

The Bottom Line
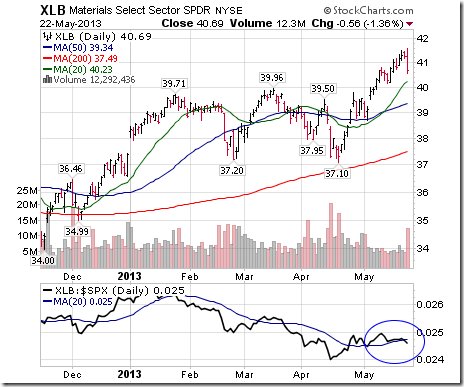
Economic sensitive sectors with strong positive seasonality traits (e.g. Industrials, Consumer Discretionary, Technology and Materials) are leading equity markets on the upside. Preferred strategy is to accumulate equity markets and sectors with favourable seasonality on weakness in order to take advantage of the October 28th to May 5th period of strength.
Equity Trends
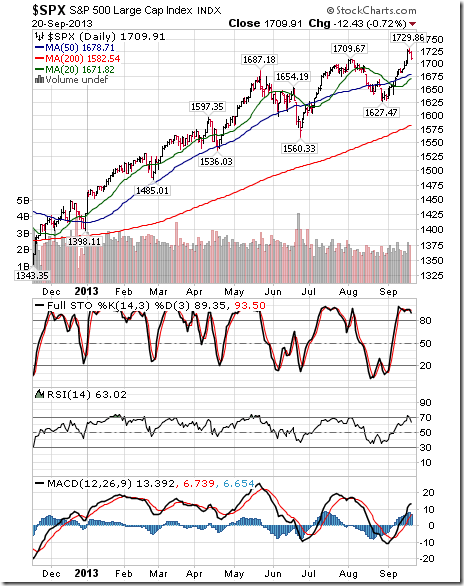
The S&P 500 Index added 6.58 points (0.37%) last week. Trend remains up. The Index closed at an all-time high. The Index remains above its 20, 50 and 200 day moving averages. Short term momentum indicators remain at overbought levels.
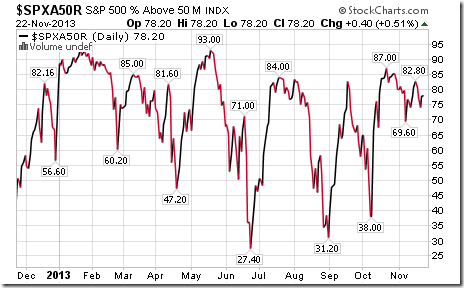
Percent of S&P 500 stocks trading above their 50 day moving average slipped last week to 78.20% from 82.80%. Percent remains overbought.
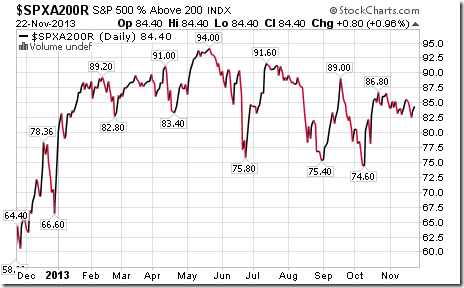
Percent of S&P 500 stocks trading above their 200 day moving average slipped last week to 84.40% from 85.60%. Percent remains intermediate overbought.
Bullish Percent Index for S&P 500 stocks increased last week to 83.80% from 83.40% and remained above its 15 day moving average. The Index remains intermediate overbought.
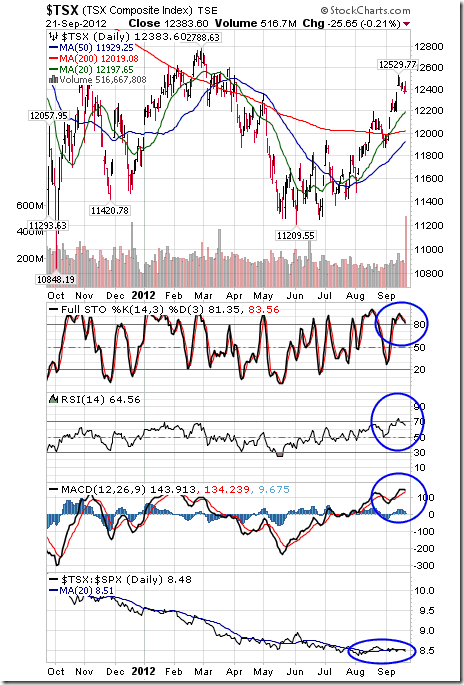
The TSX Composite Index slipped 4.23 points (0.03%) last week. Trend remains up (Score: 1.0). The Index remains above its 20 day moving average (Score: 1.0). Strength relative to the S&P 500 Index remains negative (Score: 0.0). Total score based on the above technical indicators remains at 2.0 out of 3.0. Short term momentum indicators remain overbought.
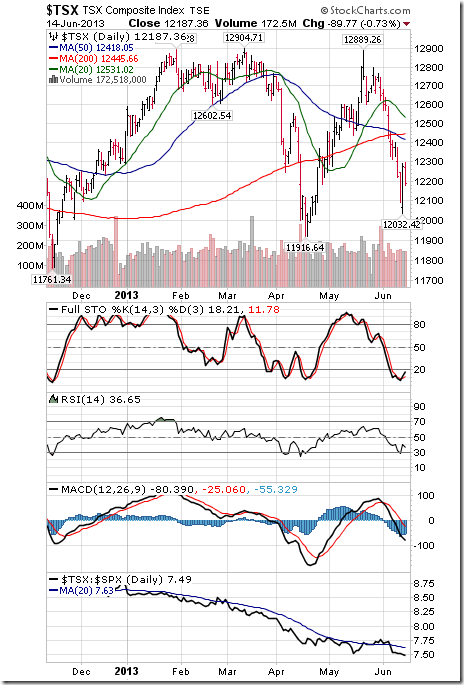
Percent of TSX Composite stocks trading above their 50 day moving average slipped last week to 58.58% from 62.76%. Percent remains intermediate overbought with a downward bias.
Percent of TSX Composite stocks trading above their 200 day moving average slipped last week to 56.90% from 57.74%.Percent remains intermediate overbought with a downtrend.
….read and so much more as 34 more charts & other issues are studied in this detail HERE


