This is a review of Technology, Materials, Consumer Discretionary, Industrials, Energy, Financials, Consumer Staples, Health Care & Utilities:
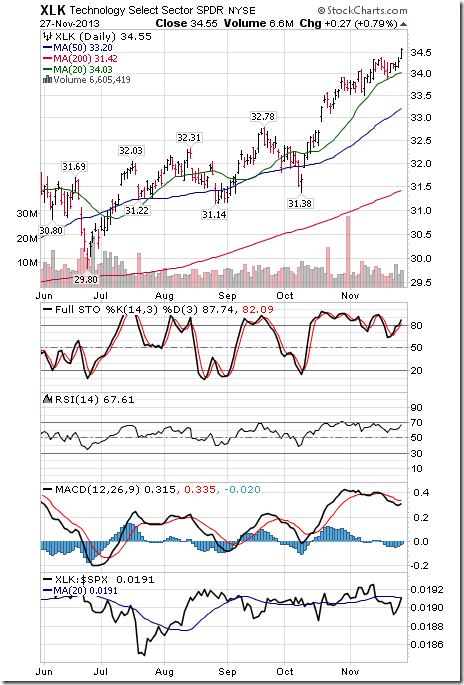
Technology
· Trend remains up (Score: 1.0). Units closed at a 13 year high on Wednesday
· Units remain above their 20 day moving average (Score: 1.0)
· Strength relative to the S&P 500 Index changed from negative to neutral (Score: 0.5)
· Technical score based on above indicators improved to 2.5 from 2.0 out of 3.0
· Short term momentum indicators returned to overbought levels.
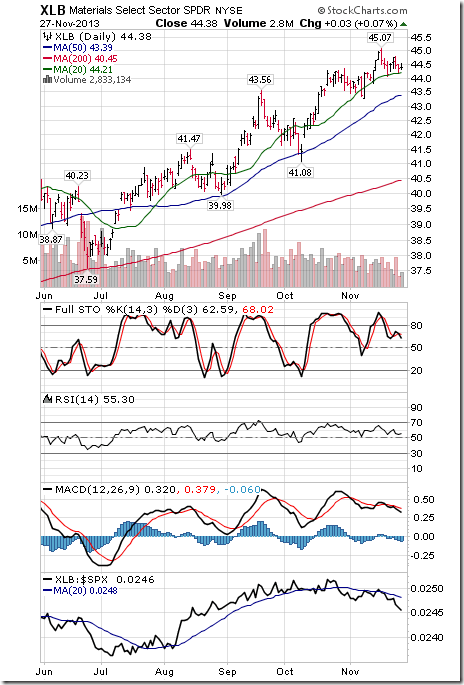
Materials
· Trend remains up. Resistance is forming at $46.07.
· Units remain above their 20 day moving average
· Strength relative to the S&P 500 Index remains negative
· Technical score remains at 2.0 out of 3.0
· Short term momentum indicators are rolling over from overbought levels
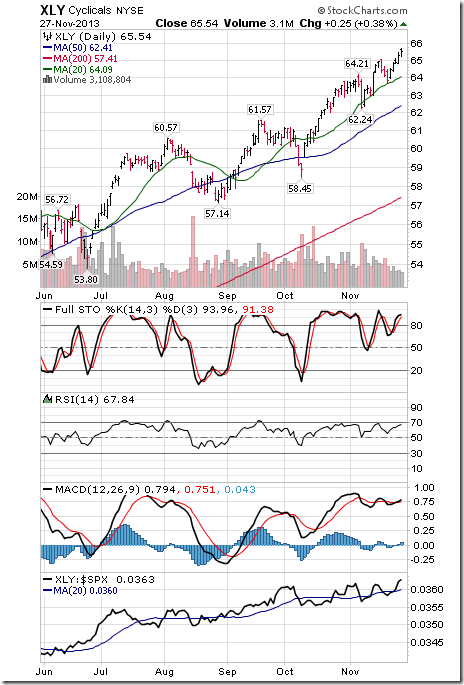
Consumer Discretionary
· Trend remains up. Units closed at an all-time high on Wednesday
· Units remain above their 20 day moving average
· Strength relative to the S&P 500 Index changed from neutral to positive
· Technical score increased to 3.0 from 2.5 out of 3.0.
· Short term momentum indicators returned to an overbought level
Industrials
· Trend remains up. Units closed at an all-time high on Wednesday.
· Units remain above their 20 day moving average
· Strength relative to the S&P 500 Index improved to positive from neutral
· Technical score increased to 3.0 from 2.5 out of 3.0
· Short term momentum indicators have returned to overbought levels.
Energy
· Trend remains up.
· Units fell below their 20 day moving average on Wednesday
· Strength relative to the S&P 500 Index remains negative
· Technical score fell to 1.0 from 2.0 out of 3.0
· Short term momentum indicators have rolled over from overbought levels.
Financials
· Trend remains up.
· Units remain above their 20 day moving average
· Strength relative to the S&P 500 Index remains positive
· Technical score remains at 3.0 out of 3.0
· Short term momentum indicators are overbought.
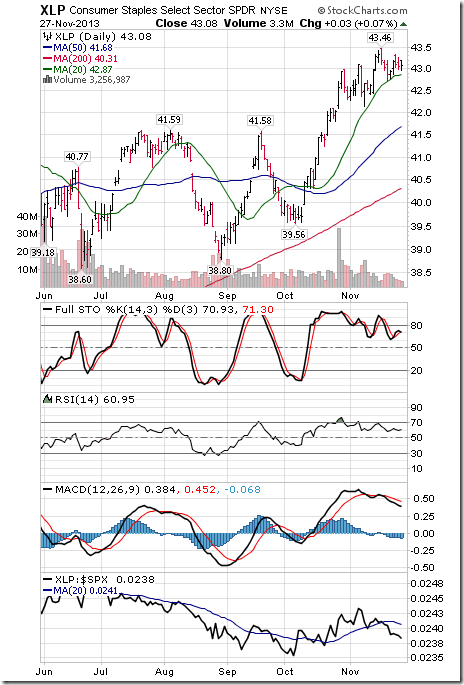
Consumer Staples
· Trend remains up. Resistance is forming at $43.46
· Units remain above their 20 day moving average
· Strength relative to the S&P 500 Index changed from neutral to negative
· Technical score slipped to 2.0 from 2.5 out of 3.0
· Short term momentum indicators are rolling over from overbought levels.
Health Care
· Trend remains up
· Units remain above their 20 day moving average
· Strength relative to the S&P 500 Index remains positive
· Technical score remains at 3.0 out of 3.0
· Short term momentum indicators are overbought.
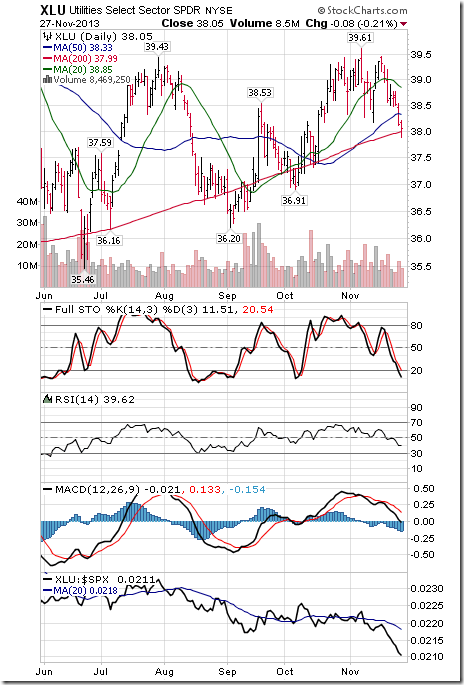
Utilities
· Trend changed from up to down on a move below $38.18
· Units remain below their 20 day moving average
· Strength relative to the S&P 500 Index remains negative.
· Technical score dropped to 0.0 from 1.0 out of 3.0
· Short term momentum indicators are trending down.
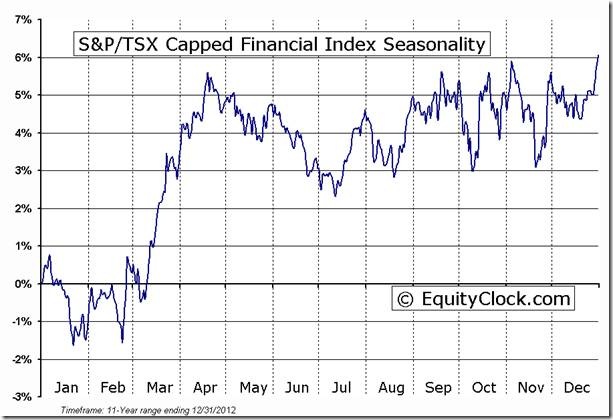
SEASONALITY: Equityclock.com offers free access to seasonal studies on over 1000 big and moderate cap securities and indices, most that have been updated very recently.
To login, simply go to http://www.equityclock.com/charts/
Following is an example:
S&P/TSX Capped Financial Index Seasonal Chart