
INSTITUTIONAL ADVISORS
FRIDAY, JANUARY 17, 2014
BOB HOYE
PUBLISHED BY INSTITUTIONAL ADVISORS
The following is part of Pivotal Events that was
published for our subscribers January 8, 2014.
Signs Of The Times
“Global bond sales from emerging markets have defied all odds to hit a record high in 2013.”
– Financial Times, January 2
“Emerging-market stocks fell to a four-month low.”
– Bloomberg, January 3
Looks like a big rotation from stocks to reaching for yield.
“The total debt of local governments in China has soared to nearly $3 trillion on the country’s addiction to credit-fueled growth.”
– The New York Times, December 30
“Faced with a mountain of maturing loans this year, China has given local governments the go-ahead to issue bonds as a way of rolling1 over their debt – to avoid default.”
– Financial Times, January 2
“Another Ice Age?”
“Scientists have found indications of global cooling. There has been a noticeable expansion of the so-called circumpolar vortex.”
– Time, June 24, 1974
“But not only does the cold spell not disprove climate change, it may well be that global warming could be making the occasional bout of extreme cold weather even more likely. Right now much of the U.S. is in the grip of a ‘polar vortex’.”
– Time, January 6, 2014
In the 1980s disaster some wag observed that “a rolling loan gathers no loss”
In 1974, Time could relate global cooling to, well, global cooling delivered to a neighborhood near you via the polar vortex. In the mid-1970s, Ibn Browning noted that lengthy cooling trends were accompanied by deeper loops in the jet stream. In 2014, Time explains that this cold spell and polar vortex is due to global warming.
In the 1600s, tortured logic and writing was needed to promote the theory that the solar system revolved around the Earth. And now with Global Warming it is still the feature of promoting government science.
During the summer months, US weather stations recorded 2899 record lows and 667 record highs.
“Excessively high temperatures are already harming public health.”
– President Obama, November 1
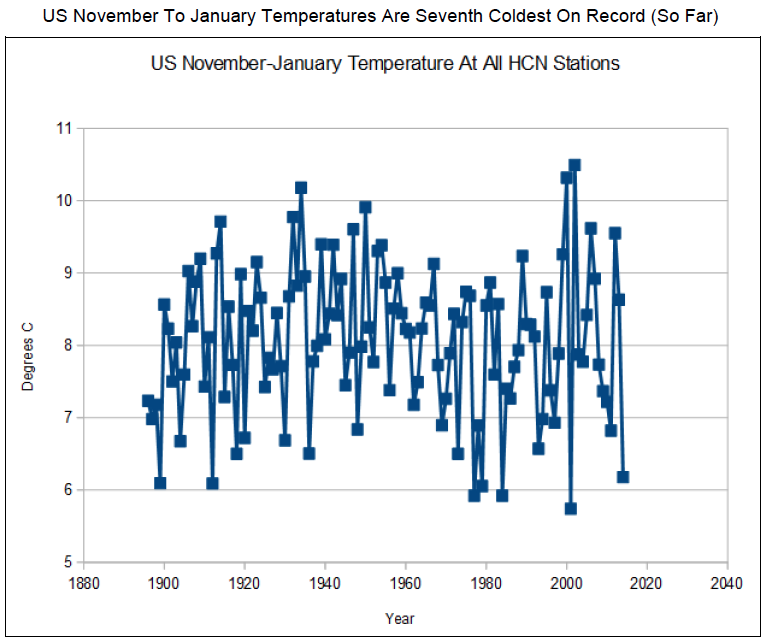
A chart of US November to January Temperatures follows.
* * * * *
Credit Markets
The December 30th ChartWorks “Early Signs Of A Shift In Credit Markets” noted a negative divergence on the stock market – a technical alert.
More toward fundamentals, would be the action in the treasury yield curve. This served in 2007 when we noted that such a boom would run some 12 to 16 months against an inverted curve. Short rates increase faster than long rates. Early in 2007 we counted out that June would be the “Sixteenth Month” and the curve reversed in that fateful May. This was followed in June with credit spreads reversing. At that point even the most massive stimulus was doomed.
Going into the blow-off of March 2000, we just used the record of rising long rates. Typically the boom will run some 12 to 18 months against rising rates. Beginning in January 2000, we frequently noted that March was the “Eighteenth Month”. It was, and it was the “killer”.
On this credit cycle, long rates set their low in July 2011 and December is the “Eighteenth Month”.
Retrospectively, this worked on the very important stock market high in January 1973. Why was it so important – the worst bear since the 1930s followed. Charts are attached.
Any competent central banker should know this. Should know it well enough not to “fight the tape”.
As the stock market rolls over so will lower-grade bonds which are in “never-never” land.
This represents weak pricing power in most of industry and commerce.
This melancholy condition would be confirmed when the CRB takes out the November low of 272.
Precious Metals
Our main theme has been that the precious metals sector would trade opposite to the universe of orthodox investments. Lately this has been fully committed to stocks and lower-grade bonds.
The “opposite” play became evident in September 2012 when Bernanke’s decision to buy bonds was celebrated as a reason to buy gold and silver. This drove the RSI on the silver/gold ratio to 84, which we noted as a measure of “dangerous” speculation.
Orthodox favourites have soared to equally “dangerous” levels of speculation and as this fails it will set precious metals up as the “go to” sector.
The opportunity shows in the Monthly RSI, with that for the S&P at 77 and that for the HUI at 29.7. Both are at extremes.
While the sector is outstanding in prospect, the transition could be choppy.
Link to January 10, 2014 Bob Hoye interview on TalkDigitalNetwork.com:
http://talkdigitalnetwork.com/2014/01/stats-show-us-equity-market-drop-likely/


The boom has run 18 months against rising long rates.
- The typical duration has been from 12 to 18 months.
- A number of booms ended at “Month Eighteen”.
- The 1973 example is shown as it ended in January of that fateful year.
BOB HOYE, INSTITUTIONAL ADVISORS
E-MAIL bhoye.institutionaladvisors@telus.net
WEBSITE: www.institutionaladvisors.com
PIVOTAL EVENTS – JANUARY 8, 2014


