

Strength in mid-week last week is expected to prove to be the last chance to take profits in a variety of seasonal trades that were approaching their average exit dates. Intermediate downside risk remains. Any short term strength will provide an opportunity to reduce positions.
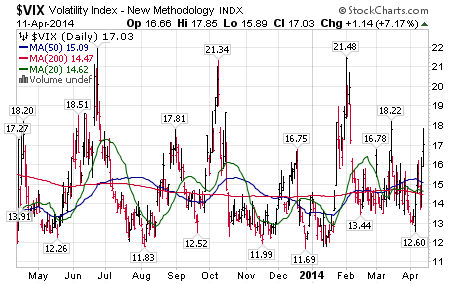
The VIX Index spiked 3.07 (21.99%) last week. The Index moved above its 20, 50 and 200 day moving averages.
Technical action by individual equities in the S&P 500 was bearish last week. On Friday, 48 S&P 500 stocks broke intermediate support levels. Look for more stocks breaking support than stocks breaking resistance this week.
Technical action by individual equities in the TSX Composite Index was neutral. Energy stocks dominated the list of stocks breaking resistance. Seasonal influences in the sector remain positive until early May.
Major breakdowns by broadly based U.S. equity indices last week imply that an intermediate correction has started. Short and intermediate technical indicators for U.S. indices and sectors generally are trending down from overbought levels.
Economic news this week is expected to confirm a rebound in the U.S. economy from depressed December/early March weather-depressed levels.
First quarter reports start to pour in this week. Main focus is on the Financial Services sector. Technology also is in focus. The market is anticipating a “difficult” comparison for earnings and revenues on a year-over-year basis. Consensus for S&P 500 companies on average is no change from last year. However, most first quarter reports are released at annual meetings where stock splits, dividend increases and share buy backs frequently are announced.
Historically during U.S. Midterm Presidential Election years, U.S. equity indices have reached an intermediate high near the middle of April followed by a correction that lasts until early October. Technical action last week suggests that the correction this year already has started. We are not alone with this call. Following is a link to a MarketWatch.com call published on Friday with a headline reading, “A bigger 10%-15% correction is coming this autumn: Bank of America/Merrill Lynch”.
http://blogs.marketwatch.com/thetell/2014/04/11/a-bigger-10-15-correction-is-coming-this-autumn-bank-of-america-merrill-lynch/
International focus this week is on China’s first quarter GDP to be released on Wednesday. Consensus is for a slowdown to 7.3% from 7.7% in the fourth quarter. Other international focuses include developments in Ukraine, Venezuela and Iran.
Trading activity is expected to diminish during the week as the Good Friday holiday approaches.
Weakness in the U.S. Dollar continues to impact equity markets, particularly the Materials and Energy sectors.
Equity markets outside of the U.S. continue to show positive returns on a real and relative basis.
Equity Trends
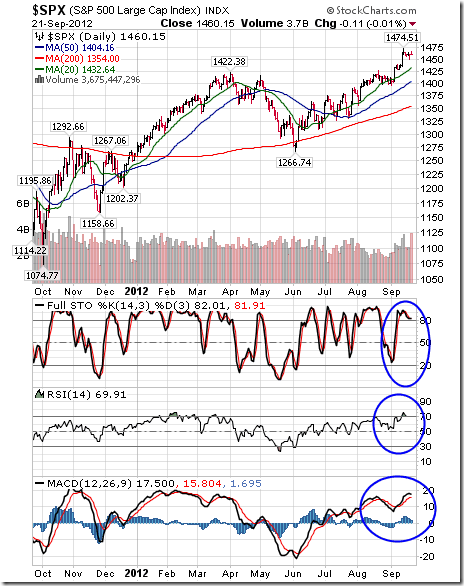
The S&P 500 Index plunged 49.40 points (2.65%) last week. Trend changed from up to neutral when the Index fell below the 1,839.57. The Index remains below its 20 day moving average and fell below its 50 day moving average. Short term momentum indicators are trending down.
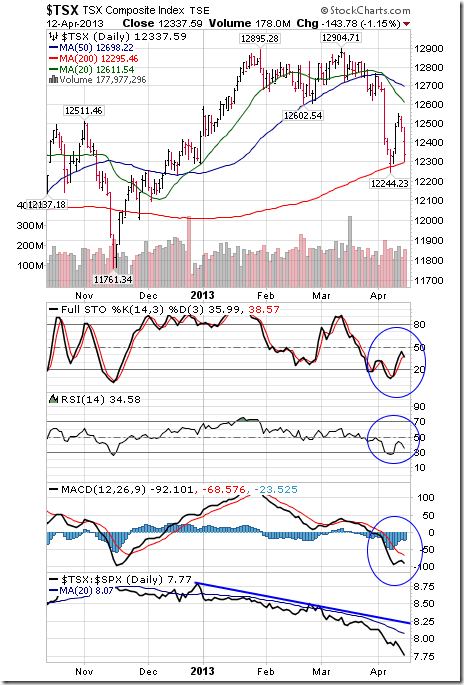
The TSX Composite Index fell 135.41 points (0.94%) last week. Intermediate trend remains up (Score: 1.0). The Index fell below its 20 day moving average (Score: 0.0). Strength relative to the S&P 500 Index changed to positive from neutral (Score: 1.0). Technical score based on the above technical indicators slipped to 2.0 from 2.5 out of 3.0. Short term momentum indicators are trending down.
To view 45 more charts & comments go HERE
Special Free Services available through www.equityclock.com
Equityclock.com is offering free access to a data base showing seasonal studies on individual stocks and sectors. The data base holds seasonality studies on over 1000 big and moderate cap securities and indices. To login, simply go tohttp://www.equityclock.com/charts/


