

The Stockscores Approach Simplified
Over the past 15 years, I have been developing and writing about my approach to the market. When I look back through the archive of Stockscores weekly newsletters, the daily newsletter atTradescores.com, my course books, articles I have written for different media outlets and my most recent book, The Mindless Investor, it is clear that there are a lot of words out there. I can imagine that a person who is new to my approach could get overwhelmed with understanding it all or even knowing where to start.
Clearly, it is time to condense my approach down to a manageable group of articles and videos with the ultimate aim of understanding the different strategies that I use for trading stocks. That is a task that I am immersed in now with the ultimate goal of having a new education area on Stockscores.com. However, that is a job that is going to take some time.
For this week’s newsletter, I want to give a simplified overview of the Stockscores Approach to trading and how everything fits together.
To begin, an overly simplified explanation of what it is I do as a trader. I look for abnormal trading activity out of predictive chart patterns.
That one sentence pretty much describes all of my trading strategies. I realized a long time ago that most market beating trends start with abnormal trading activity but not all abnormal trading activity leads to market beating trends. The best opportunities come when the abnormal trading activity comes from one of the predictive chart patterns that I look for.
Abnormal trading activity is something that can be identified by a computer; it is something that can be described mathematically. Predictive chart patterns are more subjective, you have to learn to see them and it takes practice to get good at it.
You can apply the concept to different time frames. A longer term trader will look for abnormal activity from predictive patterns on a 3 year weekly chart. That is what I tend to do for the stocks I feature in this newsletter each week. The medium term trader will look for these strategy set ups on a daily chart, doing the research process each day either after the first hour of trading or in the evenings.
How to apply my method on the weekly and daily time frames is what I teach in the Stockscores Investor course.
For a person who has the time and desire to trade the market more actively, there is the Active Trader course which teaches my active trading strategies. Same concept, look for abnormal trading activity from a predictive chart pattern but do it on a chart that has a shorter time frame. I tend to use 30, 13 and 2 minute charts. Shorter time frame means it takes more of your time but you also have an opportunity to turn your capital over more often and improve return.
As I write this, I have found three stocks that fit the criteria of my Simple Swing strategy which uses 13 minute charts. In the first few hours of the trading day, those three stocks are up a reward for risk of 4, which means $500 risked on each trade currently have a profit of $2000. Yes, trading is simple enough that you can do it while writing a newsletter article.
Concepts like reward for risk are what make up the material that needs to be understood if you are going to apply my strategies. My book, The Mindless Investor, is a good starting point for learning these concepts. Each week, I write this newsletter to focus on basic concepts of trading and there is an archive of newsletters going back to 2003 that you can use to expand your knowledge of the basics.
The greatest value that I provide comes in my strategies. Not just the rules for when to buy, sell and manage risk but also the processes and tools used to find them. My strategies are taught in my courses which also include the support I give to my students while they learn my approach.
Learning my approach is a process. Read these weekly articles and read/www.stockscores.com/mindless.asp“>The Mindless Investor to get started. Then complete the Investor or Active Trader course to learn the strategy rules and processes. Use the Stockscores Market Scan (Investor) and the Stockscores indicators for Tradestation (Active Trader) to find trades. Practice trading without risking capital using the trading simulator at Tradescores.com. Once successful on the simulator, start to trade with real money.
Trading should be kept simple. For me, it is about abnormal activity and predictive chart patterns. Everything else is part of the effort to overcome emotion and stay focused on the strategy. Trading is simple, but not easy.
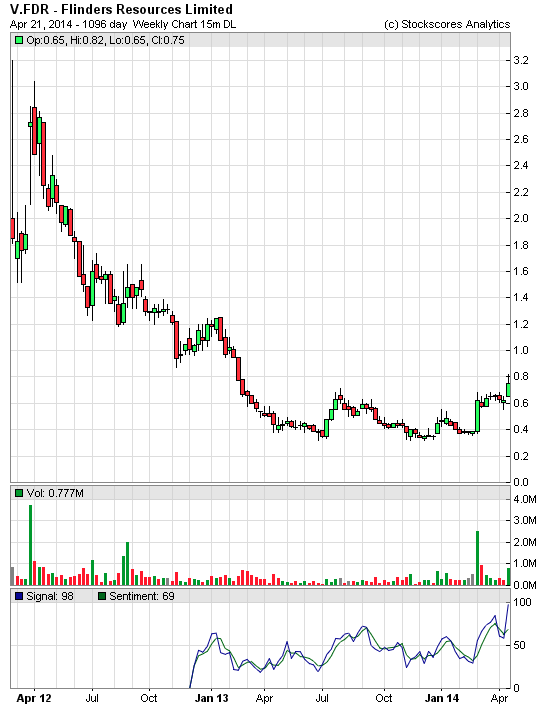
This week, I ran a scan for stocks making abnormal price gains with abnormal volume and then inspected the weekly charts for a good pattern. It seems traders are a bit slow to get back to trading after the long weekend as there are not too many stocks making strong moves. One does stand out, see below.
V.FDR has been trading sideways for about a year and making a nice price pattern. Today, it is breaking through resistance with strong volume and looks like it has decent potential to go to $1.20. The company is a Graphite miner, an area that is heating up because Graphite is used in batteries for green technologies. My main concern with this stock is that it is not yet very liquid. Also consider V.GPH. Support at $0.55.
- Get the Stockscore on any of over 20,000 North American stocks.
- Background on the theories used by Stockscores.
- Strategies that can help you find new opportunities.
- Scan the market using extensive filter criteria.
- Build a portfolio of stocks and view a slide show of their charts.
- See which sectors are leading the market, and their components.
Disclaimer
This is not an investment advisory, and should not be used to make investment decisions. Information in Stockscores Perspectives is often opinionated and should be considered for information purposes only. No stock exchange anywhere has approved or disapproved of the information contained herein. There is no express or implied solicitation to buy or sell securities. The writers and editors of Perspectives may have positions in the stocks discussed above and may trade in the stocks mentioned. Don’t consider buying or selling any stock without conducting your own due diligence.


