


In This Week’s Issue:
– Stockscores’ Market Minutes Video – Short Term Outlook
– Stockscores Trader Training – Changing the Chart Time Frame
– Stock Features of the Week – Gold Breakouts
Stockscores Market Minutes Video – Short Term Outlook
The shorter your forecast outlook, the shorter the time frame of the chart you study. This week, Tyler applies his analysis of the markets in a shorter term time frame with an outlook for where the markets will go next week.
Trader Training – Changing the Chart Time Frame
Stock chart analysis is becoming more and more popular every day; investors are realizing that the chart is a graphical representation of what thousands of investors believe about a stock and is often more reliable than the opinion of just one person’s fundamental analysis.
The problem is that there is a lot of incorrect chart analysis happening and one of the most common mistakes I see is the use of the wrong chart for making a decision.
Do you look at monthly, weekly, daily, hourly or even minute by minute charts when doing chart analysis? The answer should be motivated by the type of investor you are.
A long term trader, someone trying to maximize the return of their long term retirement portfolio should not get too caught up in the day to day gyrations of the market. It is the big picture trend of the market that should matter the most, making the gain or loss for the stock or the overall market on a single day quite irrelevant to the trading decision.
On the other end of the time frame spectrum are the day traders who should really be concerned with what is happening on the 2 minute, 5 minute or 15 minute charts. For the short term trader, these time frames are the most relevant and yet the decisions of many short term active traders are swayed by the headlines they read about big macro economic issues that could affect the long term direction of the market. The level of debt that the US Government has does not have a lot of relevance to what a hot bio tech stock is going to do over the next day.
On Stockscores.com, it is possible to set the default time from of the charts you look at to suit your trading time horizon. If you are a long term trader, set the default to a three year weekly chart. Medium term? Focus on the daily chart. A swing trader can set his or her default time frame to the 15 minute time frame.
Doing this is relatively simple.
- First, pull up the chart for any stock by entering the symbol in the upper right corner of the site. Remember that Canadian symbols need a prefix, T. for the TSX and V. for the Venture.
- Go to the charting tab, this is either beside the small chart view or below the large chart view.
- Make sure that the chart type is set to Quick.
- Set the interval to the time frame that suits you.
- Set the lookback period. I like to look back as far as possible without having the resolution of the chart degraded.
- Click on Create Chart
This has now established a new chart default which will remain as your default each time you log in using that computer. If you use a different device, you will have to reset the chart settings on that machine as well.
While it is important to focus on the time frame that suits your style the best, it is also wise to look at other time frames for confirmation. A person focused on the daily chart should check the weekly and the hourly for confirmation. A day trader may be focused on the two minute but a quick check of the 15 minute and daily will be helpful as well.
You can do that using the fast time frame links that you will see at the top of the chart. Click on one of these to change the time frame quickly without changing default chart.
![]()
This week, I ran the Stockscores Simple Weekly Market Scan for the Canadian market in search of stocks that are in the early stage of an upward trend. There are many strong stocks which have been going up for some time. It is harder to find those that are just starting to break from a predictive chart pattern on the weekly chart. I found the best potential in a couple of Gold stocks, a sector that has been making a comeback so far in 2015.
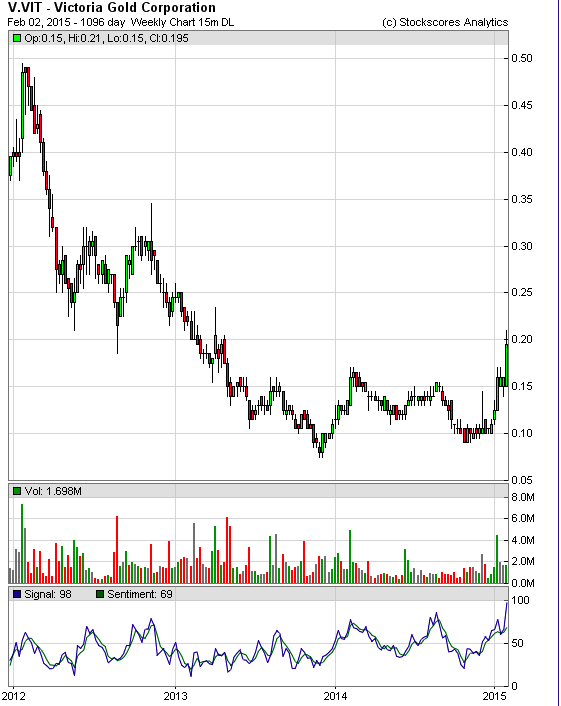
1. V.VIT
V.VIT traded strong volume and made a good gain today, breaking it out through resistance going back over a year. This stock is not very liquid and highly speculative so smaller positions are only appropriate. Next level of resistance is at $0.30, support at $0.14.
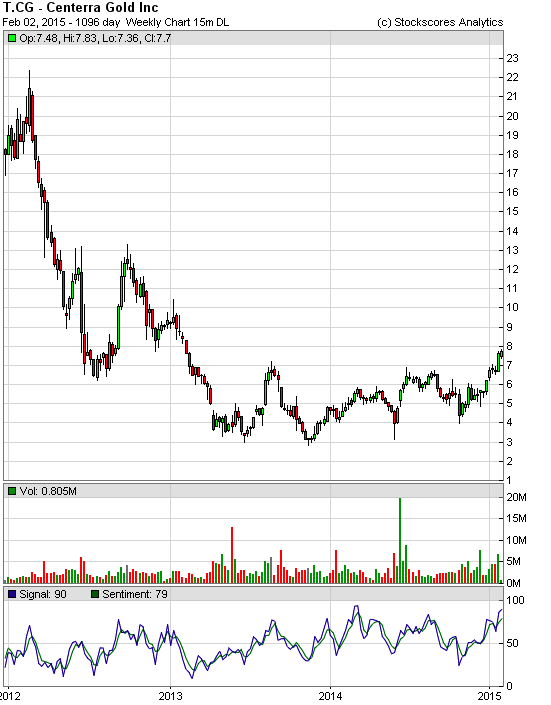
2. T.CG
T.CG broke through $7 resistance last week after a lengthy period of sideways trading and base building. Support at $6.60, resistance at $12.
References
- Get the Stockscore on any of over 20,000 North American stocks.
- Background on the theories used by Stockscores.
- Strategies that can help you find new opportunities.
- Scan the market using extensive filter criteria.
- Build a portfolio of stocks and view a slide show of their charts.
- See which sectors are leading the market, and their components.
Disclaimer
This is not an investment advisory, and should not be used to make investment decisions. Information in Stockscores Perspectives is often opinionated and should be considered for information purposes only. No stock exchange anywhere has approved or disapproved of the information contained herein. There is no express or implied solicitation to buy or sell securities. The writers and editors of Perspectives may have positions in the stocks discussed above and may trade in the stocks mentioned. Don’t consider buying or selling any stock without conducting your own due diligenc


