

The intermediate-term trend for the stock market is lower…
Last week, the S&P 500 hit a low of 2,044. As I explained earlier this month, I think it is headed toward the 1,990 level between now and October.
But it’s not going to be a straight shot lower. And traders can still profit by betting on the upside when short-term conditions hit extremely oversold levels.
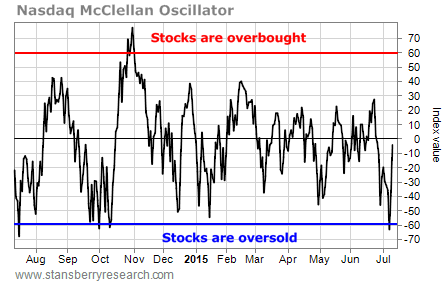
ollowing Wednesday’s sharp decline, many technical indicators hit oversold levels. For example, the McClellan Oscillator for the Nasdaq closed at -63. That’s the sort of reading that often occurs near short-term bottoms…
Also, the market’s fear gauge, the Volatility Index (the “VIX”), closed Wednesday at 19.66. That was above its upper Bollinger Band. And the current chart pattern looks similar to the market bottoms in October and December…

The VIX generated a broad stock market buy signal when it closed back inside its Bollinger Bands on Thursday. That also happened at the end of June. But I told my Stansberry Short Report subscribers at that time that, like we saw in October and December, we could get a second move back above the upper Bollinger Band before the market actually hits a short-term bottom and gives a sustainable buy signal.
As you can see from the chart, that’s exactly what happened last week.
Wednesday’s move in the VIX took the index above its upper Bollinger Band for the second time in less than a week.
We now have a much stronger buy signal.
The “double buy signal” in October led to a 10% rally in the S&P 500 in just six weeks. December’s double buy signal kicked off a 5% rally in two weeks.
Take a look at this updated chart of the S&P 500…
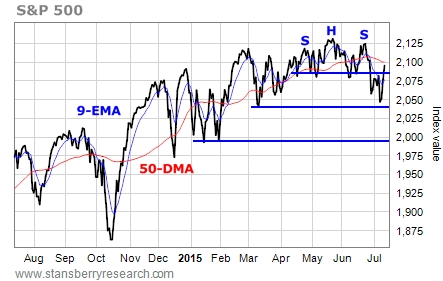
Its 2,044 low is darn close to the 2,038 target of the head-and-shoulders pattern I wrote about earlier this month. Now, with the double-buy signal from the VIX and the oversold conditions on the McClellan Oscillator, traders ought to be looking for a bounce.
The index has resistance at 2,080. That’s the neckline of the head-and-shoulders pattern. But a more likely target is the 50-day moving average line at about 2,100.
So now it’s time to start looking for ways to profit off a new short-term bounce in the market.
Don’t get me wrong… It is NOT time yet to go “all in” on the long side. I still think the broad market has lower to go between now and October. My downside target for the S&P 500 is in the area of 1,990.
But with conditions as oversold as they are right now, the stage is set for a decent one- or two-week oversold bounce.
Best regards and good trading,
Jeff Clark
Also….
It’s Still Too Early to Be Worried About the Economy


