

DOW +116 on 1500 net declines
NASDAQ COMP – 5 on 400 net declines
SHORT TERM TREND Bearish
INTERMEDIATE TERM TREND Bullish
Available Mon- Friday after 6:00 P.M. Eastern, 3:00 Pacific.
STOCKS : It was an indecisive day. Breadth was good for a change and this was encouraging.
But, it was somewhat disappointing that a pledge by Mario Draghi of the ECB that he would do wonderful things for the markets and a 5% rally in oil couldn’t push the market up more decisively.
I want to withhold judgment for the present and see what kind of follow through we have.
GOLD: Gold was down $5. This was profit taking from yesterday. The dollar was lower.
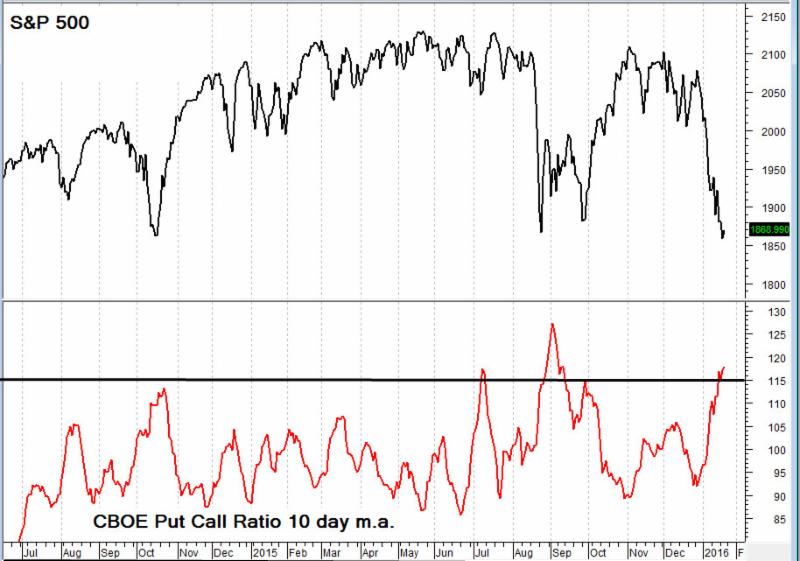
CHART: One thing for sure. We have enough pessimism to support a sustained rally. The 10 day moving average of the CBOE Put call ratio is over 1.15. This figure is normally associated with a multi week rally.
BOTTOM LINE: (Trading)
Our intermediate term system is on a buy as of August 26.
System 7 We are in cash. If there are more advancing issues than declining ones at 3:45 EST on Friday, buy the SSO at the close.
System 8 We are in cash. Stay there.
GOLD We are in cash. Stay there.
News and fundamentals: Jobless claims were 293,000, more than the expected 275,000. The Philadelphia Fed Business Outlook Survey came in at minus 3.5, less than the expected minus 4.0. On Friday we get the PMI Mfg Index Flash and existing home sales.
Interesting Stuff There is an article in the January 10 Lost Angeles Times discussing the trouble in China in human terms. Factories are closing and many of those staying open are telling workers, they can’t pay them all their salary. This has led to violent clashes. More on this tomorrow.
TORONTO EXCHAN GE: Toronto gained 193.
S&P/TSX VENTURE COMP: The TSX was up1.
BONDS: Bonds fell back sharply.
THE REST: The dollar was mildly lower. Silver was lower. Crude oil rose 5%.
Bonds –Bullish as of January 8.
U.S. dollar – Bullish as of Dec. 17.
Euro — Bearish from January 5.
Gold —-Bearish as of January 14.
Silver—- Bearish from December 14.
Crude oil —- Bearish from January 5.
Toronto Stock Exchange—- Bearish since December 8.
S&P\ TSX Venture Fund — Bearish since December 8.
We are on a long term buy signal for the markets of the U.S., Canada, Britain, Germany and France.
| Wed. | Thu. | Fri. | Tue. | Wed. | Thu. | Evaluation | |
| Monetary conditions | 0 | 0 | 0 | 0 | 0 | 0 | 0 |
| 5 day RSI S&P 500 | 17 | 37 | 26 | 27 | 22 | 29 | + |
| 5 day RSI NASDAQ | 15 | 35 | 24 | 24 | 23 | 23 | + |
|
McCl-
lAN OSC.
|
-268 | -168 | -239 | -247 | -274 | -174 |
+
|
| Composite Gauge | 17 | 7 | 15 | 13 | 15 | 10 | 0 |
| Comp. Gauge, 5 day m.a. | 15.0 | 13.0 | 12.6 | 12.8 | 13.4 | 12.0 | 0 |
| CBOE Put Call Ratio | 1.19 | 1.01 | 1.55 | .90 | 1.18 | 1.09 |
+
|
| VIX | 25.22 | 23.95 | 27.02 | 26.05 | 27.54 | 26.69 | + |
| VIX % change | +12 | -5 | +13 | -4 | +6 | -3 | 0 |
| VIX % change 5 day m.a. | +4.6 | -0.6 | +0.4 | +1.6 | +4.4 | +1.4 | 0 |
| Adv – Dec 3 day m.a. | -812 | -498 | -1141 | -676 | -1534 | -520 | + |
| Supply Demand 5 day m.a. | .33 | .46 | .52 | .48 | .48 | .57 | 0 |
| Trading Index (TRIN) | 1.16 | .65 | 1.76 | 1.16 | 1.11 | .88 |
0
|
|
S&P 500
|
1890 | 1922 | 1880 | 1881 | 1859 | 1869 | Plurality +6 |
INDICATOR PARAMETERS
Monetary conditions (+2 means the Fed is actively dropping rates; +1 means a bias toward easing. 0 means neutral, -1 means a bias toward tightening, -2 means actively raising rates). RSI (30 or below is oversold, 80 or above is overbought). McClellan Oscillator ( minus 100 is oversold. Plus 100 is overbought). Composite Gauge (5 or below is negative, 13 or above is positive). Composite Gauge five day m.a. (8.0 or below is overbought. 13.0 or above is oversold). CBOE Put Call Ratio ( .80 or below is a negative. 1.00 or above is a positive). Volatility Index, VIX (low teens bearish, high twenties bullish), VIX % single day change. + 5 or greater bullish. -5 or less, bearish. VIX % change 5 day m.a. +3.0 or above bullish, -3.0 or below, bearish. Advances minus declines three day m.a.( +500 is bearish. – 500 is bullish). Supply Demand 5 day m.a. (.45 or below is a positive. .80 or above is a negative). Trading Index (TRIN) 1.40 or above bullish. No level for bearish.
No guarantees are made. Traders can and do lose money. The publisher may take positions in recommended securities.


