
A look back at stock market performance in two major bear market years of 2000 & 2008 reveals some interesting findings:
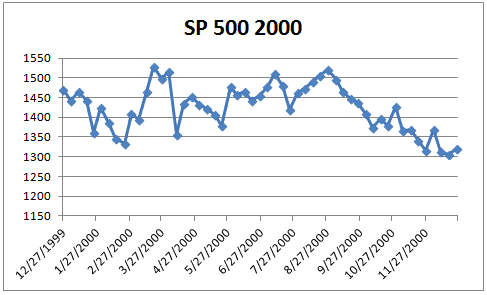
First lets look at the S&P500 Chart in 2000:

The market dropped 10% to start the year. It proceeded to recover most of its losses by late March failing at prior highs eventually falling over 15% further post August.
Next lets look at the S&P500 Chart in 2008:
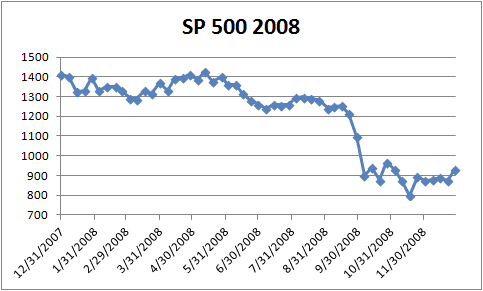
The market again dropped 10% to start the year. It proceeded to recover most of its losses by early May and then collapsing over 50% into October.
That brings us to Today’s market:
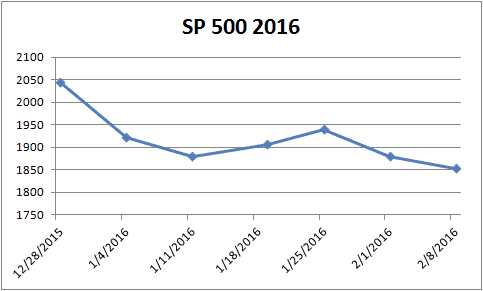
We have again dropped 10% to start the year. If we go by what the market did in 2000 and 2008 we should recover most of these losses by May and then begin a major collapse into August and September following an oversold bounce out of the March 2016 lows.


