
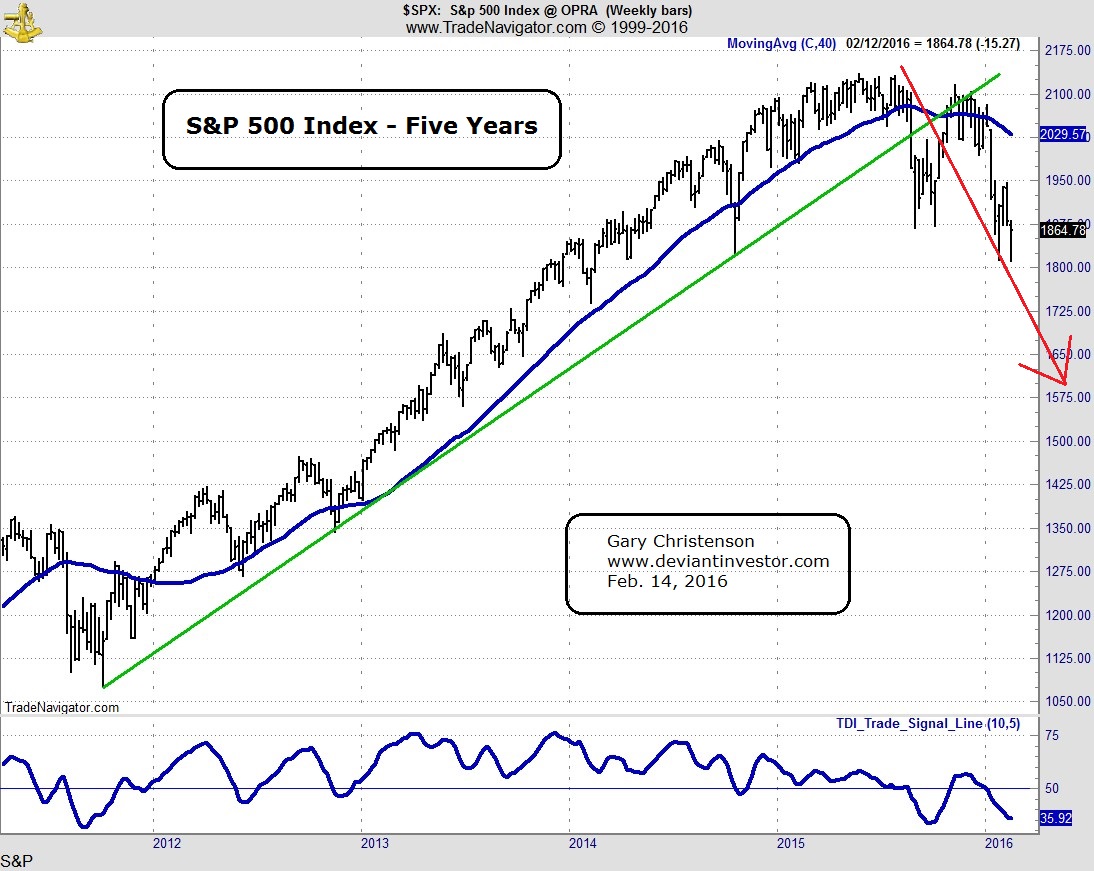
The S&P 500 Index (chart below) shows a top in May 2015, a correction into August, and a deeper fall this month – February 2016. Look out below.
The Shanghai Composite Index looks grim.


Posted by Gary Christenson - The Deviant Investor
Share on Facebook
Tweet on Twitter
The S&P 500 Index (chart below) shows a top in May 2015, a correction into August, and a deeper fall this month – February 2016. Look out below.
The Shanghai Composite Index looks grim.

I know Mike is a very solid investor and respect his opinions very much. So if he says pay attention to this or that - I will.
~ Dale G.
I've started managing my own investments so view Michael's site as a one-stop shop from which to get information and perspectives.
~ Dave E.
Michael offers easy reading, honest, common sense information that anyone can use in a practical manner.
~ der_al.
A sane voice in a scrambled investment world.
~ Ed R.

Greg Weldon

Josef Schachter

Tyler Bollhorn

Ryan Irvine

Paul Beattie

Martin Straith

Patrick Ceresna

Mark Leibovit

James Thorne

Victor Adair