
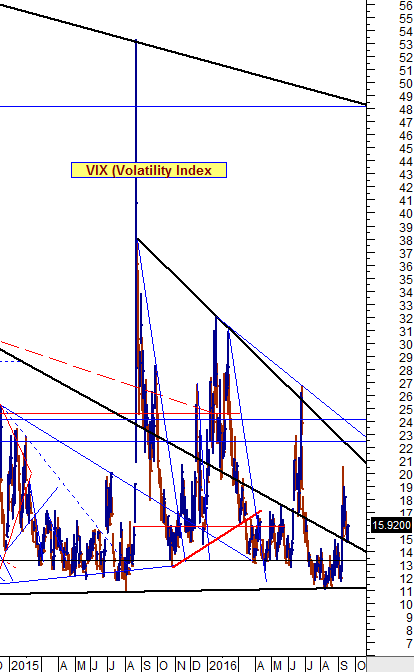
The current VIX Index (Volatility Index) chart is posted below going back to 2015.
Please note the following: The long term trend has been down with each successive peak being lower. (A lower VIX correlates with a higher stock market and a higher VIX with a lower stock market.)
The most recent peak that occurred breached the resistance line which is normally a not so good sign for later.
Yesterday (Sept. 20) the VIX closed above a long term fan line and so it will need to close below the fan line now in order for the market to get more adrenaline.

also:
The main U.S. stock market indexes gained 0.9-1.1% on Wednesday, as investors reacted to FOMCRate Decision announcement.
Stock Market Sentiment Improves Following Fed’s Rate Decision, Will The Uptrend Continue?


