

Last Tuesday, I noted that a market decision was coming soon. It came sooner than I anticipated with a sell-off that broke the bullish trend line from the February lows. To wit:
“A major decision point is rapidly approaching which will decide the fate of the market for the rest of the year.”
In the daily price chart below, the break of that bullish trend line is clearly evident.
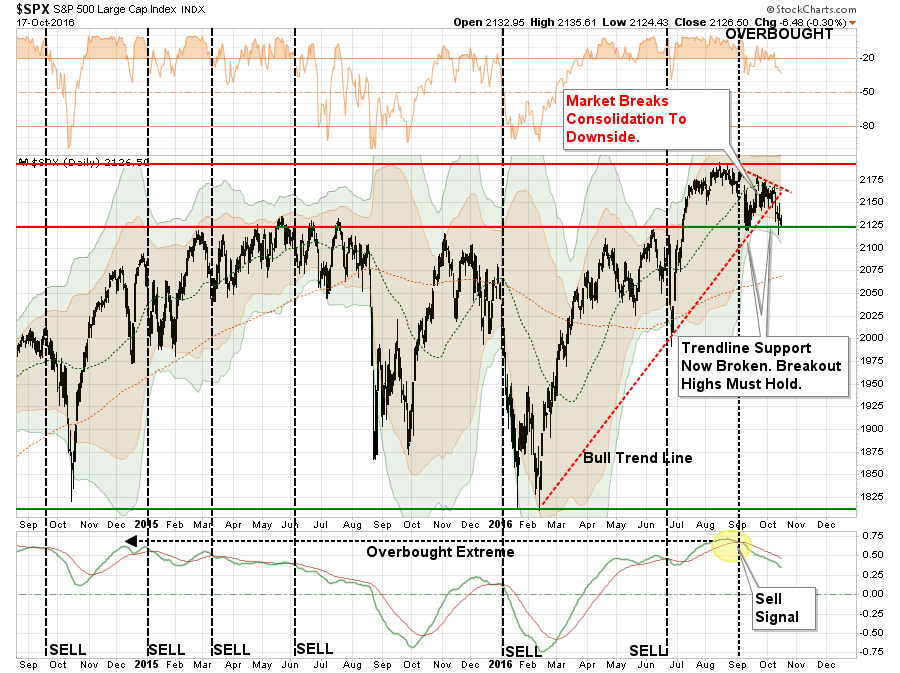
“Notice in the bottom part of the chart the market currently remains on a sell signal. That sell signal is problematic for two reasons:
1) ‘Sell signals’ combined with overbought conditions tend to lead to at least short-term corrections.
2) ‘Sell signals’ formed at very high levels, such as currently, suggests limited upside and larger correction probabilities.”
Let’s zoom in on the recent price action in the chart above. The chart below is the last 3-months of daily price movement. As you will see, while prices have been quite volatile, there has been virtually no progress in the market during the period.
….continue reading & view 9 more charts HERE


