

The Life Expectancy of Economic Expansions
Introduction
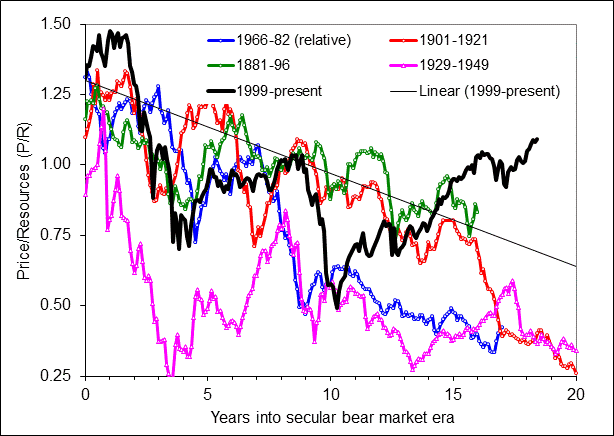
Two years ago, I wrote an article forecasting a large decline in the stock market in the next three years.[1] The focus of the article was on the forecasted size of the anticipated bear market and the justification for this forecast. There was no discussion of when such a decline might happen. In fact, the only mention of timing was in the title, which implied that it would start within the next three years. This three-year figure was the result of no deep analysis, I simply noted that the current business cycle had been going on for 7½ years and the longest business cycle on record lasted about 10½ years. The three years were simply the difference between these two. As the figure at the top shows, P/R had started to fall around the time of the article and continued to do so for nearly a year. Since then a new rally has ensued and the market has moved to higher valuations.
The new advance raises the question of just when is this decline going to happen, or is the analysis simply wrong? Since the anticipated large bear market would be accompanied by a recession, this question can be reframed as when will this expansion end, or, just how long do economic expansions last?
Analysis
The best evidence for a natural length for expansions is the fact that none of the 17 peacetime expansions before 1933 lasted longer than 36 months. Figure 1 plots the probability that one of these expansions was still in progress as a function of length. The dotted line is a linear regression fit, which implies these expansions had a natural lifespan of just over three years.
Figure 1. Distribution of business expansion lengths (data from NBER)

Three quarters of business expansions since 1933 have been longer than 36 months suggesting that something changed around that allows business expansions to survive longer today. One possibility is government policy. The economic expansions during the Civil War and World War I, at 46 and 44 months respectively, were longer than any of the other expansions before 1933. The reason for this is easy to understand, while the war lasts and the government is buying massive quantities of war materiel, recession is unlikely. In the aftermath of the 1929-1933 economic depression, the Roosevelt administration engaged on a program of massive monetary stimulation, by suspending the gold standard, followed by creation of a series of government job-creation and welfare programs. These programs provided a program of government spending like that during a war. As a result, the federal deficit averaged over 4% from 1933 to 1937, when spending was cut, bringing the budget back into balance in 1938. This expansion, at 49 months was the longest in history up to that time.
The US entered World War II during the next expansion, which then lasted until 1945, establishing a new record length of 80 months. Furthermore, this expansion was not followed by a deep depression that undid much of the employment gains made during the WW I and New Deal expansions. This experience led to changes in economic belief systems symbolized by the 1946 Employment Act, which authorized the government to promote maximum employment, production, and purchasing power and established the council of economic advisors.[2] The economic views of political and economic elites became more favorably disposed towards countercyclical policy intended to moderate the business cycle. Economic expansions grew longer as policymakers gained experience. The record-long WW II expansion was exceeded by business cycles in the 1960’s, 1980’s, 1990’s, and today. Fifteen years ago, I noted this 1933 shift in length in an article on the relation between business cycles and longer economic cycles in which I classified the periods before and after 1933 as unregulated and regulated eras.[3]
The fact that the last expansion ended quite early compared to adjacent cycles suggests that policymakers have not yet conquered the business cycle, economic expansions still end, and lengths have not been monotonically increasing. To this end the analysis of economic expansion longevity presented earlier still seems appropriate. Figure 1 also shows a plot of the 13 expansions in the regulated era. Two regression lines were needed to fit the data. Extrapolation of the second implies a lifespan for regulated expansions of just under 11 years.
Another way to think about this is in terms of the probability of recession as a function of length or in terms of the number of years an expansion can be expected to last given its age. Table 1 shows the results of calculations of these statistics for the regulated era. Shown is the probability of recession in the next year for expansions in regulated era. Also shown is the expected length of expansion as a function of its current age. The values for expansion lengths beyond 10 years (the longest one ever) is based on the extrapolation of the regression line shown in Figure 1.
Table 1. Expansion mortality rate and life expectancy of expansions as a function of age
| Year | Recession Probability (%/yr) | Life Expectancy (yrs) |
| 4 | 15 | 7.4 |
| 5 | 17 | 7.9 |
| 6 | 21 | 8.4 |
| 7 | 26 | 8.9 |
| 8 | 35 | 9.4 |
| 9 | 55 | 9.9 |
| 10 | 73 | 10.4 |
When I wrote the June 2015 article, the current expansion was 6 years old, for which Table 1 implies it would last another 2½ years. Since the stock market typically peaks about six months before the economy, this suggests a peak around two years later, or about now. Such an expectation is consistent with the three years given in the article title. But given that the business expansion is now 8 years old, Table 1 projects a median value of 1½ additional years of expansion, corresponding to a bull market peak about a year from now. That is, there is now a 50% probability that the current bull market will end more three years after June 2015. Based on the 11-year projected lifespan, this expansion could last as long as another three years. Assuming the median expectation of another year for the bull market, extrapolation of the post-election rally projects a level approaching 25000, implying a much larger decline than the 10000-point forecast in 2015.
References:
[1] Alexander, M. A., 10000 point decline in the Dow in the cards over the next three years, Safehaven, June 10, 2015. (http://www.safehaven.com/article/37933/stock-cycles)
[2] De Long, J. Bradford, 1996, Keynesian, Pennsylvania Avenue Style: Some Economic Consequences of the Employment Act of 1946, Journal of Economic Perspectives, 10(3), 41-53. http://www-personal.umich.edu/~kathrynd/JEP.DeLong.pdf
[3] Alexander, M. A., Generations and Business Cycles – Part I, Safehaven, November 6, 2002. (http://www.safehaven.com/article/85/generations-and-business-cycles-part-i)


