

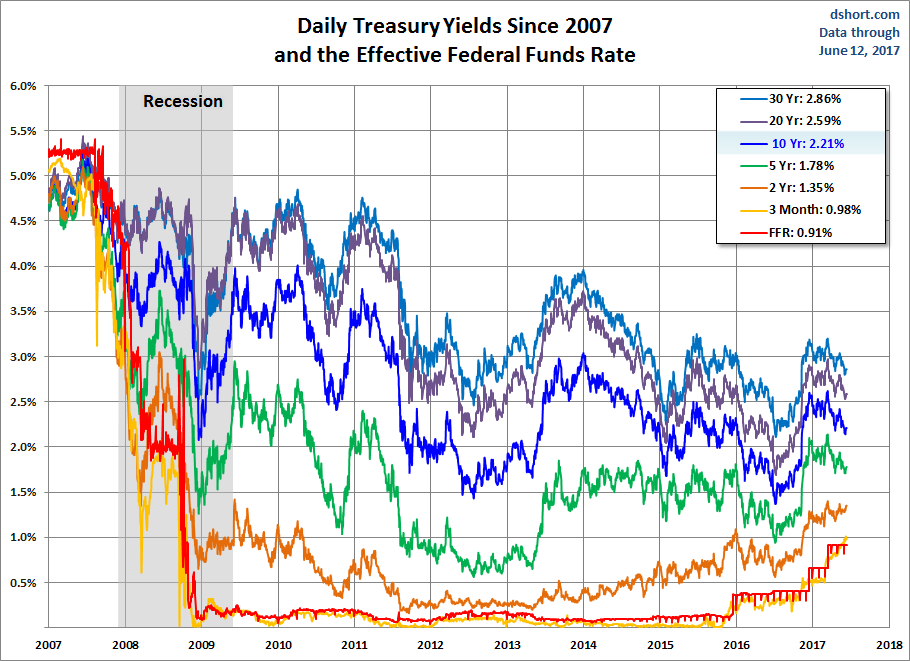
Let’s take a closer look at recent activity in US Treasuries. The yield on the 10-year note ended the day at 2.21% and the 30-year bond closed at 2.86%, well off their interim highs.
Here is a table showing the yields highs and lows and the FFR since 2007 as of today’s close.

The 2-10 yield spread is now at 0.86%.
The chart below shows the daily performance of several Treasuries and the Fed Funds Rate (FFR) since the pre-recession days of equity market peaks in 2007.
A Long-Term Look at the 10-Year Note Yield
A log-scale snapshot of the 10-year yield offers a more accurate view of the relative change over time. Here is a long look since 1965, starting well before the 1973 Oil Embargo that triggered the era of “stagflation” (economic stagnation with inflation). The trendline (the red one) connects the interim highs following those stagflationary years. The red line starts with the 1987 closing high on the Friday before the notorious Black Monday market crash. The S&P 500 fell 5.16% that Friday and 20.47% on Black Monday.
…continue HERE to view chart & commentary


