
Available Mon- Friday after 3:00 pm Pacific.
DOW – 4 on 625 net advances
NASDAQ COMP + 52 on 305 net advances
SHORT TERM TREND Bullish
INTERMEDIATE TERM Bullish
STOCKS: The Dow was down, but most indices were higher. The NASDAQ was a star, helped by a stellar performance by Netflix and the high techs.
Our job is very simple. We keep raising our stops on trading positions and let this monster take us where it will.
GOLD: Gold jumped $8 to a new rally high. The sagging dollar was a factor.
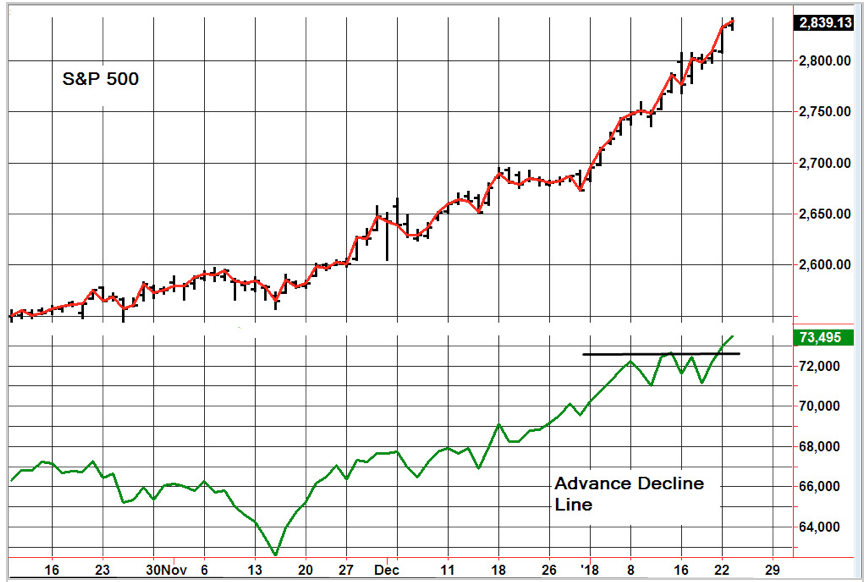
CHART: We had been concerned about breadth as the averages appeared to be leaving the advance decline line behind. But now it appears that this consolidation is over and breadth has now broken to a new all time high.
As usual, there are concerns. The S&P is very extended and the CBOE put call ratio was very low today. We would not be surprised by a bit of short term weakness, but the chart pattern remains bullish.

BOTTOM LINE: (Trading)
Our intermediate term system is on a buy.
System 7 We are long the SSO from 110.59. Move your stop to 120.59.
System 9 On a buy signal from Dec. 29.
NEWS AND FUNDAMENTALS: There were no economic releases of consequence on Tuesday. On Wednesday we get the PMI Composite Flash, existing home sales and oil inventories.
INTERESTING STUFF: I attribute the little I know to my not having been ashamed to ask for information, and to my rule of conversing with all descriptions of men on those topics that form their own peculiar professions and pursuits. ———John Locke
TORONTO EXCHANGE: Toronto gained 10.
BONDS: Bonds rebounded slightly.
THE REST: The dollar hit another new low. Crude oil surged to a new rally high.
Bonds –Bearish as of Jan. 9.
U.S. dollar – Bearish as of Jan 12.
Euro — Bullish as of Jan 12.
Gold —-Bullish as of Jan 12.
Silver—- Bullish as of Jan 12.
 Crude oil —-Bullish as of Dec. 26.
Toronto Stock Exchange—- Bullish as of September 20, 2017.
We are on a long term buy signal for the markets of the U.S., Canada, Britain, Germany and France.
Monetary conditions (+2 means the Fed is actively dropping rates; +1 means a bias toward easing. 0 means neutral, -1 means a bias toward tightening, -2 means actively raising rates). RSI (30 or below is oversold, 80 or above is overbought). McClellan Oscillator ( minus 100 is oversold. Plus 100 is overbought). Composite Gauge (5 or below is negative, 13 or above is positive). Composite Gauge five day m.a. (8.0 or below is overbought. 13.0 or above is oversold). CBOE Put Call Ratio ( .80 or below is a negative. 1.00 or above is a positive). Volatility Index, VIX (low teens bearish, high twenties bullish), VIX % single day change. + 5 or greater bullish. -5 or less, bearish. VIX % change 5 day m.a. +3.0 or above bullish, -3.0 or below, bearish. Advances minus declines three day m.a.( +500 is bearish. – 500 is bullish). Supply Demand 5 day m.a. (.45 or below is a positive. .80 or above is a negative). Trading Index (TRIN) 1.40 or above bullish. No level for bearish.
No guarantees are made. Traders can and do lose money. The publisher may take positions in recommended securities.


