
Wednesday January 31, 2018 www.toddmarketforecast.com
Available Mon- Friday after 6:00 P.M. Eastern, 3:00 Pacific.
DOW + 73 on 186 net advances
NASDAQ COMP + 9 on 699 net declines
SHORT TERM TREND Bullish
INTERMEDIATE TERM Bullish
STOCKS: Very choppy day. In the early going, the Dow was up a whopping 261 points. It then proceeded to give it all back, eventually going underwater by 25 points before surging back.
So, what is going on? Most likely end of month adjustments complicated by computer algorithms.
January was up150 S&P 500 points or 5.6%. According to the Stock Trader’s Almanac, an up January predicts that the remainder of the year will be up with an 89.1% accuracy.
Near term setbacks aside, this market should have further gains in store, not only because of the above statistic, but because of earnings and decreased regulations.
GOLD: Gold was up $9. Long term rates were lower and the Fed declined to raise short term rates.
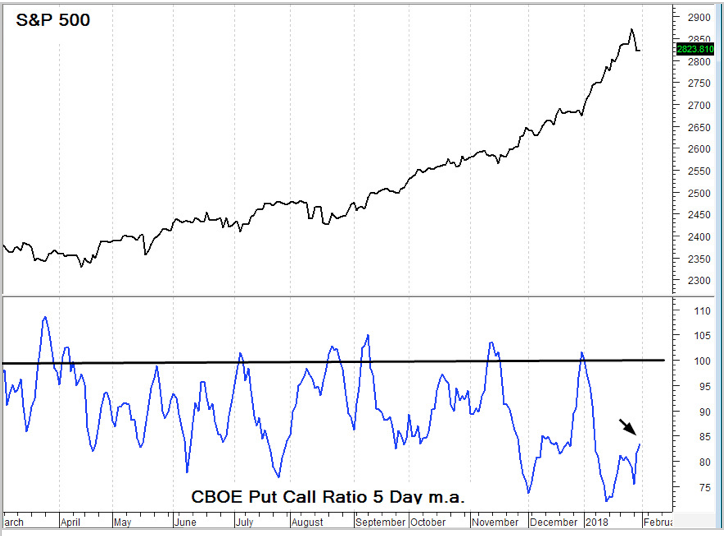
CHART: We continue to be somewhat concerned about the low readings of the 5 day m.a. of the CBOE Put Call Ratio. The decline should have put more fear into option traders.

BOTTOM LINE: (Trading)
Our intermediate term system is on a buy.
System 7 We are in cash. We are concerned about the low readings of the put call ratio, but most gauges are oversold. Let’s try a scalp. Buy the SSO at the open on Thursday.
System 9 Currently neutral.
NEWS AND FUNDAMENTALS: The ADP employment report showed an additional 234,000 jobs. The consensus was for 195,000. Oil inventories rose 6.8 million. Last week they dropped 1.1 million. On Thursday we get jobless claims, the PMI manufacturing index and the ISM manufacturing index.
INTERESTING STUFF: Our greatest weakness lies in giving up. The most certain way to succeed is always to try just one more time. —Thomas A. Edison
TORONTO EXCHANGE: Toronto was down 4.
BONDS: Bonds rebounded somewhat.
THE REST: The dollar was lower. Crude oil bounced.
Bonds –Bearish as of Jan. 9.
U.S. dollar – Bearish as of Jan 12.
Euro — Bullish as of Jan 12.
Gold —-Bearish as of Jan 26.
Silver—- Bearish as of Jan 26.
Crude oil —-Bearish as of January 30.
Toronto Stock Exchange—-Bearish as of January 29, 2018.
We are on a long term buy signal for the markets of the U.S., Canada, Britain, Germany and France.

Monetary conditions (+2 means the Fed is actively dropping rates; +1 means a bias toward easing. 0 means neutral, -1 means a bias toward tightening, -2 means actively raising rates). RSI (30 or below is oversold, 80 or above is overbought). McClellan Oscillator ( minus 100 is oversold. Plus 100 is overbought). Composite Gauge (5 or below is negative, 13 or above is positive). Composite Gauge five day m.a. (8.0 or below is overbought. 13.0 or above is oversold). CBOE Put Call Ratio ( .80 or below is a negative. 1.00 or above is a positive). Volatility Index, VIX (low teens bearish, high twenties bullish), VIX % single day change. + 5 or greater bullish. -5 or less, bearish. VIX % change 5 day m.a. +3.0 or above bullish, -3.0 or below, bearish. Advances minus declines three day m.a.( +500 is bearish. – 500 is bullish). Supply Demand 5 day m.a. (.45 or below is a positive. .80 or above is a negative). Trading Index (TRIN) 1.40 or above bullish. No level for bearish.
No guarantees are made. Traders can and do lose money. The publisher may take positions in recommended securities.


