
Ross Clark has specialized in technical analysis of the markets since the 1970’s. Through exhaustive historical analysis he is so good at market timing and shifts in asset allocation that Bob Hoye of Institutional Advisors brought him onboard. Today he gives quite an education in Post-Bubble environments and relates them to a current existing opportunity in Bitcoin. R. Zurrer for Money Talks
Bitcoin – Oversold and Into Support
Post-Bubble environments have some of the most repetitive characteristics as they unwind the excesses of the euphoric phase that took them into the top. Most result in lengthy bear markets (Dow 1929, Gold 1980, Nikkei 1989, NASDAQ 2000, Silver 2011, 3-D Systems 2014 & Shanghai 2015). A few manage to form new bases from which to move to new highs (Biotech’s 2015 & Canopy Growth 2016).
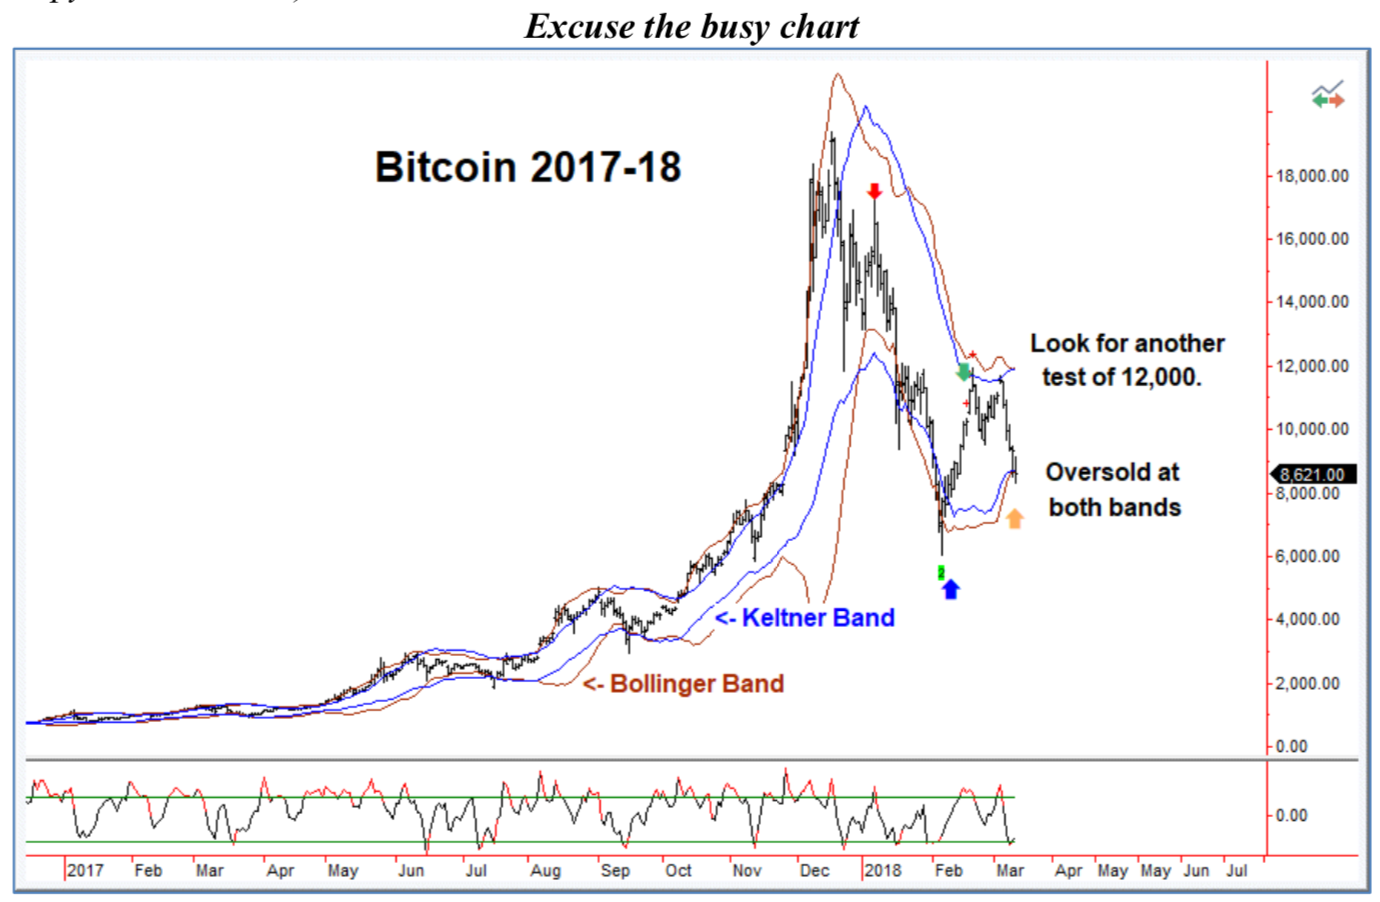
Excuse the busy chart

The overbought rally into January 8th (red arrows) in Bitcoin (NYXBT) and Bitcoin Investment Trust (GBTC) provided a secondary sell signal following the Sequential 13 Sell on December 19th. Prices then dropped 65%. Good interim lows at that point in ‘Post Bubble’ markets have occurred around the 50-week ema or 100-week simple moving average. . . when coupled with a weekly CCI(8) reading of -150. Bitcoin generated a reading of -149 and GBTC at -143 at the 50-week ema during the February 9th low (blue arrows).
The next action was a retracement rally to February 20th, trading temporarily above our upside target of 10,600. It created the characteristic daily overbought signal against the upper 20-day Bollinger Band (green arrows). As of Friday, it has dropped to the lower Bollinger and Keltner
bands (orange arrow). Keltner Bands are a style of volatility band using Average True Ranges and generate a smoother band.
Whatever low is created within the next few days should become the critical one. We can expect a rally back through the upper Bollinger Band and more likely to the Keltner Band (currently 11,886).
The ability to hold above the low at this point of development was the case following last July’s low at $7.73 in Canopy Growth. The biotech index (BTK) did the same thing in 2016, holding above its July low of 2807. These went on to new highs. The other six examples violated the support (red line) and went on to make multi-year lows.
Weekly charts of other bubbles.
Red arrows identify secondary daily sale after the top.
Blue arrows are oversold weekly CCI(8) readings. Green arrows are next daily overbought
signal.. Orange arrows are daily oversold at the Bollinger Band. Note how important the red support line becomes.

Slides from the World Outlook Financial Conference presentaion February 3, 2018 (Click on each Chart for Larger Version)


Opinions in this report are solely those of the author. The information herein was obtained from various sources; however, we do not guarantee its accuracy or completeness. This research report is prepared for general circulation and is circulated for general information only. It does not have regard to the specific investment objectives, financial situation, and the needs regarding the appropriateness of investing in any securities or investment strategies discussed or recommended in this report and should understand that statements regarding future prospects may not be realized.
Investors should note that income from such securities, if any, may fluctuate and that each security’s price or value may rise or fall. Accordingly, investors may receive back less than originally invested. Past performance is not necessarily a guide to future performance. Neither the information nor any opinion expressed constitutes an offer to buy or sell any securities or options or futures contracts. Foreign currency rates of exchange may adversely affect the value, price or income of any security or related investment mentioned in this report. In addition, investors in securities such as ADRs, whose values are influenced by the currency of the underlying security, effectively assume currency risk. Moreover, from time to time, members of the Institutional Advisors team may be long or short positions discussed in our publications.
CHARTWORKS – 3/11/2018


