
For Mon. April 16, 2018 3:00 Pacific
DOW + 213 on 1285 net advances
NASDAQ COMP + 50 on 851 net advances
SHORT TERM TREND Bullish
INTERMEDIATE TERM Bullish
STOCKS: The market went into the weekend with Middle Eastern war fears, but the end result was a positive. President Trump did what he promised and there was very little reaction from the other belligerents in the area.
The Dow was up over 300 at one point then some talk about additional tariffs hit the wire and this caused a bit of a retreat, but it was still a good day and the pattern of ascending highs and ascending lows is still holding on the daily charts of the important indices.
GOLD: Gold was flat in spite of a decent drop by the dollar. The yellow metal seems a bit confused at present.
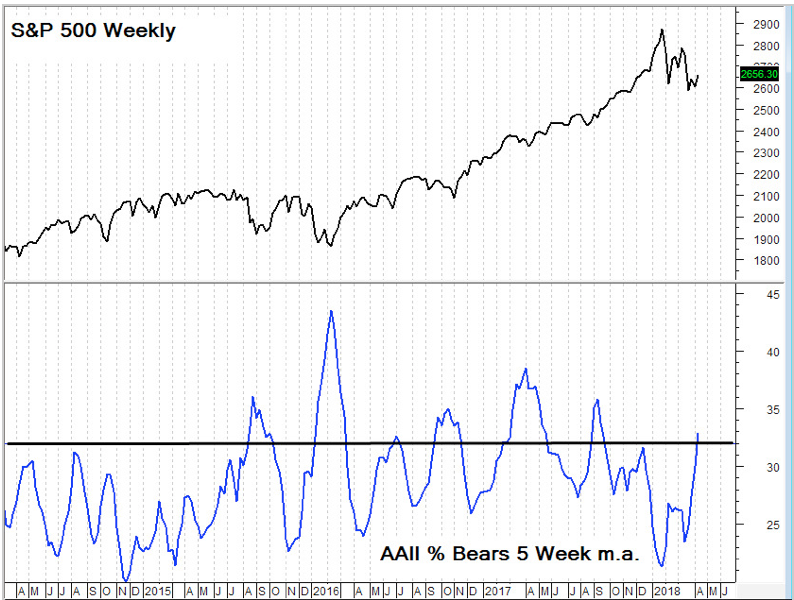
CHART: Sentiment is falling into place for a tradable rally from current levels. The put call ratios have been favorable. Now, the surveys are coming along. When the bearish percentage of the 5 week moving average of the American Association of Individual investors exceeds 32, we generally have weeks of upside in store.

BOTTOM LINE: (Trading)
Our intermediate term system is back on a buy.
System 7 We are long the SSO from 107.07. Stay with it on Tuesday.
System 9 Currently neutral
NEWS AND FUNDAMENTALS: Retail sales rose 0.6%, better than the expected 0.4%. The Empire State mfg survey came in at 15.8, less than the consensus 18.2. The housing market index came in at 69, less than the expected 70. On Tuesday we get industrial production and housing starts.
INTERESTING STUFF: When I want to understand what is happening today or try to decide what will happen tomorrow, I look back.— Omar Khayyam
TORONTO EXCHANGE: Toronto gained 26
BONDS: Bonds inched up again.
THE REST: The dollar sank to a seven day low. Crude oil retreated from an overbought condition.
Bonds –Bearish as of April 3.
U.S. dollar – Bearish as of April 9.
Euro — Bullish as of April 9.
Gold —-Bearish as of March 27.
Silver—- Bearish as of March 27.
Crude oil —-Bullish as of April 11 .
Toronto Stock Exchange—-Bullish as of Feb. 12.
We are on a long term buy signal for the markets of the U.S., Canada, Britain, Germany and France.

Monetary conditions (+2 means the Fed is actively dropping rates; +1 means a bias toward easing. 0 means neutral, -1 means a bias toward tightening, -2 means actively raising rates). RSI (30 or below is oversold, 80 or above is overbought). McClellan Oscillator ( minus 100 is oversold. Plus 100 is overbought). Composite Gauge (5 or below is negative, 13 or above is positive). Composite Gauge five day m.a. (8.0 or below is overbought. 12.0 or above is oversold). CBOE Put Call Ratio ( .80 or below is a negative. 1.00 or above is a positive). Volatility Index, VIX (low teens bearish, high twenties bullish), VIX % single day change. + 5 or greater bullish. -5 or less, bearish. VIX % change 5 day m.a. +3.0 or above bullish, -3.0 or below, bearish. Advances minus declines three day m.a.( +500 is bearish. – 500 is bullish). Supply Demand 5 day m.a. (.45 or below is a positive. .80 or above is a negative). Trading Index (TRIN) 1.40 or above bullish. No level for bearish.
No guarantees are made. Traders can and do lose money. The publisher may take positions in recommended securities.


