

“Equity markets on both sides of the border have had a good ride since their lows set on June 4th. The Dow Jones Industrial Average is up 8.8% and the S&P 500 Index has gained 9.8%. Investing in equity markets has become less attractive. Accumulation of seasonal trades on weakness continues to make sense as long as the seasonal trades are outperforming the market. Sectors in this category include agriculture, energy, leisure & entertainment, software and gold. A cautious bullish stance appears appropriate”.
Two major negative events and one positive event impacted equity markets last week. The negative events were no change in monetary policy by the Fed and no tangible news from European Central Bank head, Mario Draghi. The positive event was the employment report released on Friday. Unfortunately, news on these three events is unlikely to have a lasting impact on equity markets.
Economic news this week is quiet and is not expected to have a significant impact on equity markets.
Earnings news this week focuses on Canadian companies. Most of the biggest S&P 500 companies already have reported. A significant impact on equity markets is unlikely. Second quarter earnings continue to slightly exceed consensus earnings estimates, which, in turn are lower than the second quarter last year.
Macro events are expected to be relatively quiet this week. Watch out for the start of hurricane season!
North American equity markets have a history of moving flat to lower during the first two weeks in August.
Short and intermediate technical indicators for most equity markets and sectors are overbought, but have yet to show signs of peaking. Most equity indices and sector indices have entered into a band of intermediate resistance. Upside potential is possible, but limited.
North American equity markets have a history of moving higher from June to December during Presidential Election years. However, at least one correction during that period normally occurs.
Cash on the sidelines remains substantial and growing. However, political uncertainties (including the Fiscal Cliff) preclude major commitments by investors and corporations.
The S&P Energy Index added 1.49 points (0.28%) last week. The Index remains above its 20, 50 and 200 day moving averages. Short term momentum indicators are overbought, but continue to trend higher. Strength relative to the S&P 500 Index remains positive ‘Tis the season!

The above chart represents the seasonality for Crude Oil Futures Continuous Contract (CL) for the past 20 years Via EquityClock.com
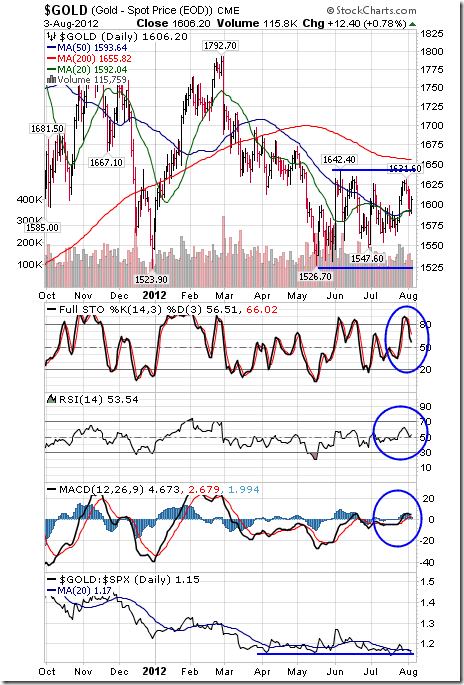
Gold slipped $13.70 per ounce (0.85%) last week. Intermediate trend is down. Support is at $1,526.70 and resistance is at $1,642.40. Gold remains below its 200 day moving average, but bounced nicely on Friday from near its 20 and 50 day moving averages. Short term momentum indicators are neutral. Strength relative to the S&P 500 Index remains neutral/slightly positive ‘Tis the season!
The above chart represents the seasonality for Gold Futures (GC) Continuous Contract for the past 20 years Via EquityClock.com
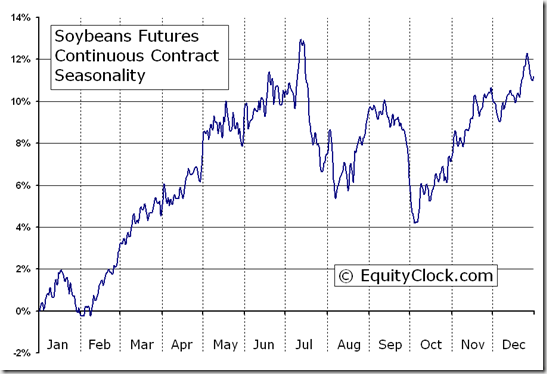
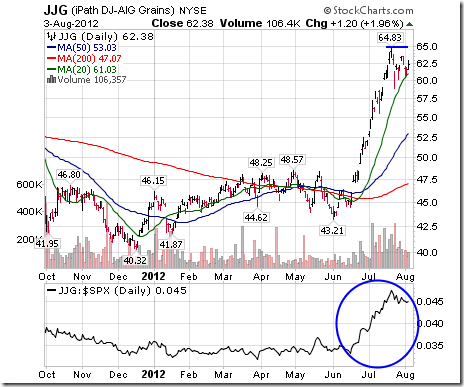
The Grain ETN added $0.46 (0.74%) last week. Intermediate trend is up. The ETN remains above its 20, 50 and 200 day MAs. Strength relative to the S&P 500 Index remains positive.
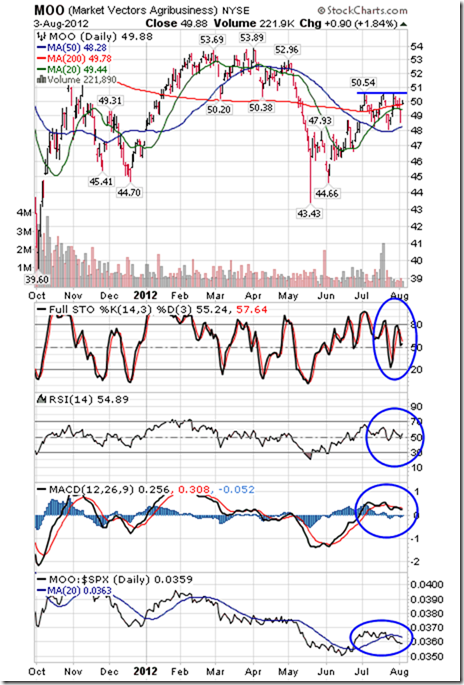
The Agriculture ETF slipped $0.48 (0.95%) last week. Intermediate trend is up. Units are testing resistance at $50.54. Units remain above their 20, 50 and 200 day moving averages. Short term momentum indicators are neutral. Strength relative to the S&P 500 Index is neutral/slightly negative.
About
Tech Talk / Timing The Market — Completely free seasonality, fundamental and technical analysis of the stock markets from a certified market leader. Market letters are published daily and are accessible though DVTechTalk.com and TimingTheMarket.ca. Comments in Tech Talk reports are the opinion of Mr. Vialoux.
Security positions held or not held by Mr. Vialoux will be indicated at the end of each Tech Talk report.


