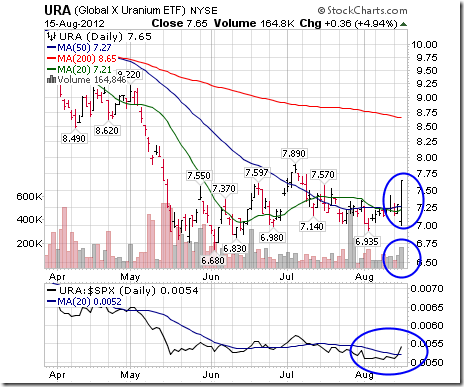
For starters, here’s an Interesting Chart:
The uranium ETF came alive yesterday. Nice break to the upside on higher volume, a move above its 20 and 50 day moving average as well as early signs of outperformance.
Mark Leibovit’s Recommended List Changes
Bulletin
Adding UEC and NLR (both uranium plays) to the recommended list at the market. I know we’re weighted heavily in uranium, but I’m looking for some further diversification. We already own URRE, USU and DNN.
Stop 1.75. Target 3.75 in UEC.
Stop 13.00. Target 18.00 in NLR.
Gold
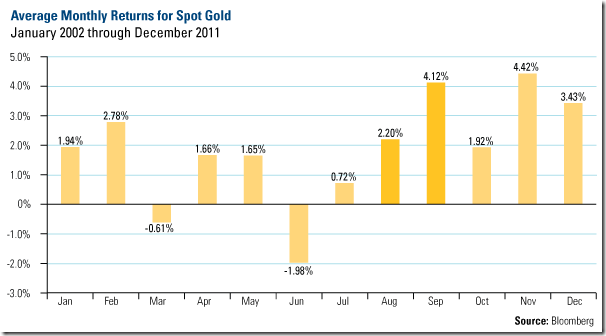
“So while gold has its monthly ups and downs, you can see that, on a historical basis, we have arrived at gold’s peak performance period of the year. Based on 10 years of data, gold bullion has historically increased 2 percent in August and 4 percent in September.”
– Frank Holmes
Source: BullionBuzzeNewsletter
Yesterday, Gold moved above its 20 and 50 day moving averages.

Yesterday, Gold moved above its 20 and 50 day moving averages – Don Vialoux
Weekly SPDR Select Sector Review
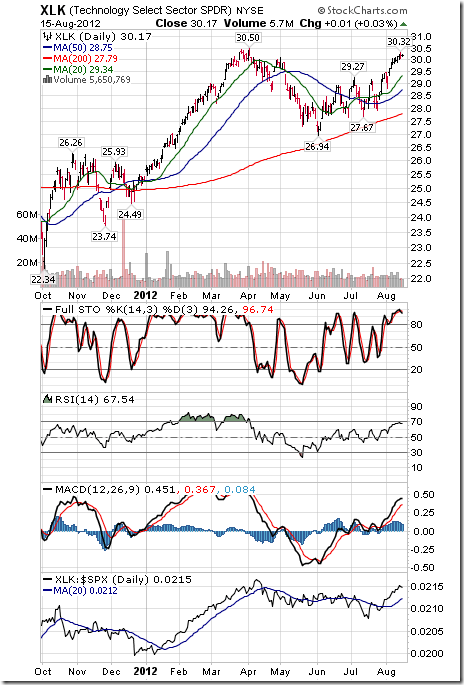
Technology
· Intermediate trend is up.
· Units remain above their 20, 50 and 200 day moving averages.
· Short term momentum indicators are overbought, but have yet to show signs of peaking.
· Strength relative to the S&P 500 Index remains positive.
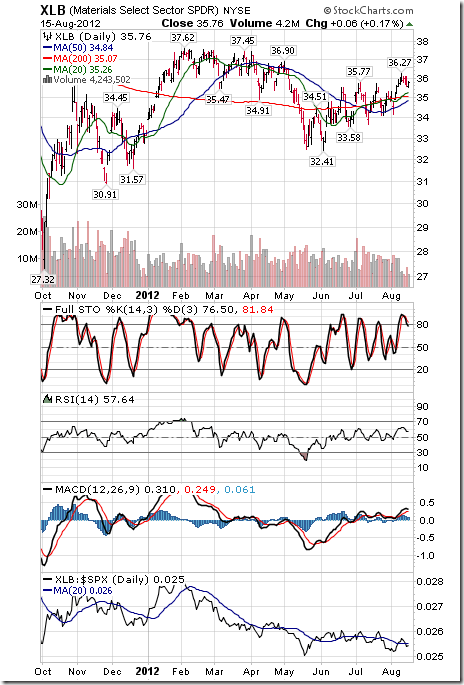
Materials
· Intermediate trend is up.
· Units trade above their 20, 50 and 200 day moving averages.
· Short term momentum indicators are overbought, but have yet to show signs of peaking.
· Strength relative to the S&P 500 Index remains neutral.
Consumer Discretionary
· Intermediate trend is neutral. Support is at $41.58 and resistance is at $46.11
· Trades above its 20, 50 and 200 day moving averages
· Short term momentum indicators are overbought, but have yet to show signs of peaking.
· Strength relative to the S&P 500 Index remains negative.
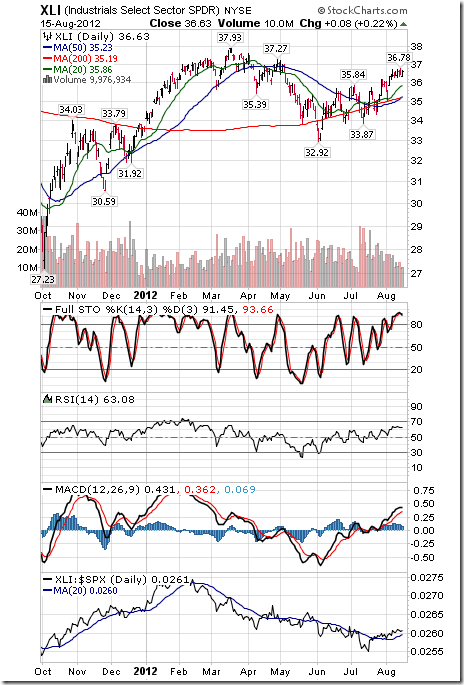
Industrials
· Intermediate trend is up.
· Trades above its 20, 50 and 200 day moving averages.
· Short term momentum indicators are overbought, but have yet to show signs of peaking.
· Strength relative to the S&P 500 Index remains positive.
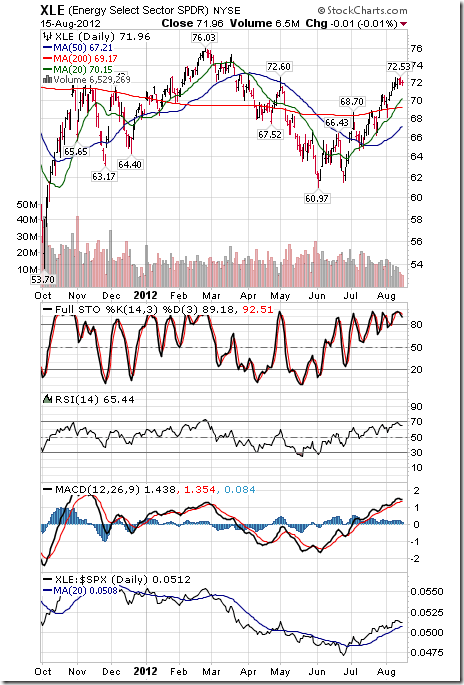
Energy
· Intermediate trend is up.
· Trades above its 20, 50 and 200 day moving averages.
· Short term momentum indicators are overbought, but have yet to show signs of peaking.
· Strength relative to the S&P 500 Index remains positive.
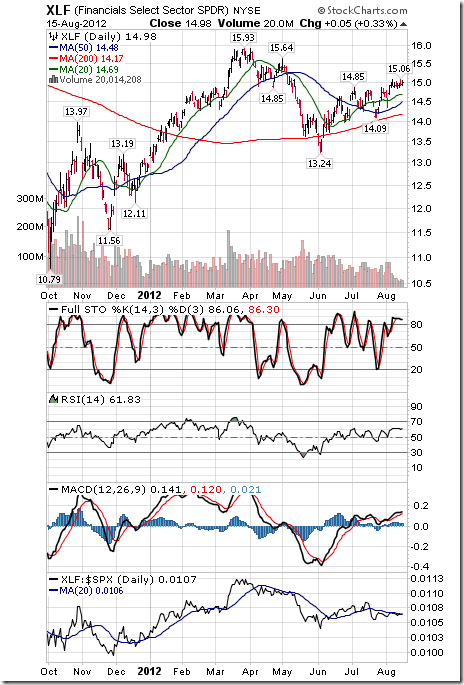
Financials
· Intermediate trend is up.
· Trades above its 20, 50 and 200 day moving averages.
· Short term momentum indicators are overbought, but have yet to show signs of peaking.
· Strength relative to the S&P 500 Index remains neutral.
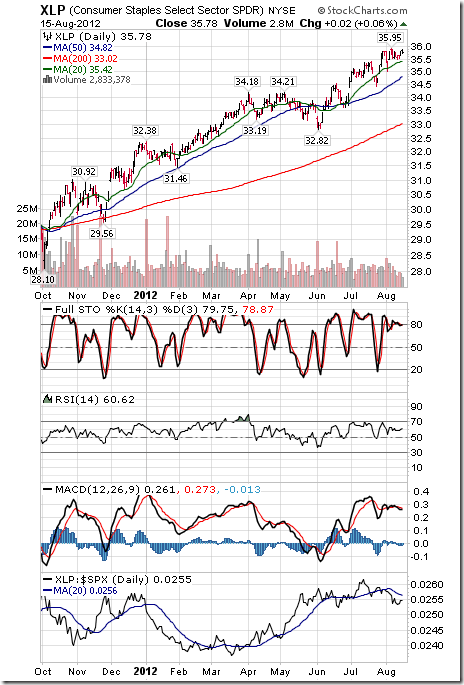
Consumer Staples
· Intermediate trend is up.
· Trades above its 20, 50 and 200 day moving averages.
· Short term momentum indicators are overbought and showing signs of rolling over.
· Strength relative to the S&P 500 Index remains negative.
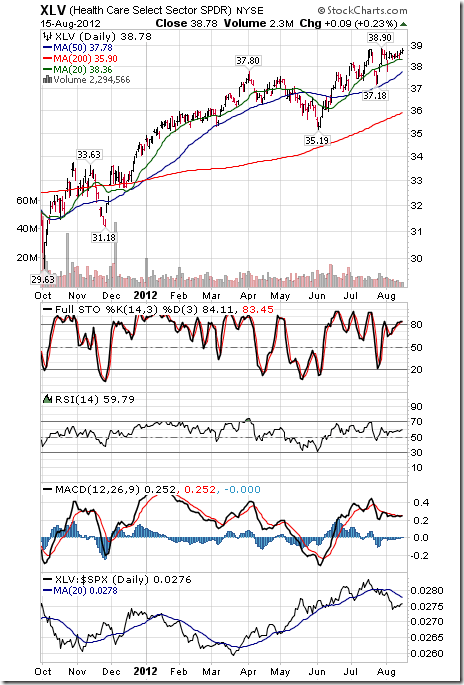
Health Care
· Intermediate trend is up.
· Trades above its 20, 50 and 200 day moving averages.
· Short term momentum indicators are overbought and showing early signs of rolling over.
· Strength relative to the S&P 500 Index remains negative.
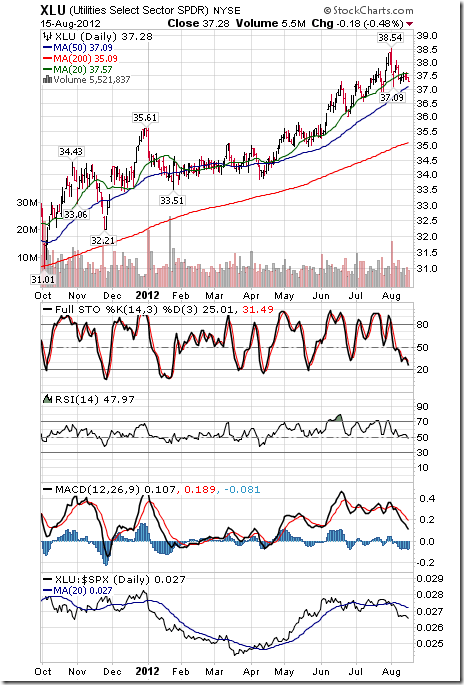
Utilities
· Intermediate trend is up
· Trades above its 50 and 200 day moving averages and below its 20 day moving average.
· Short term momentum indicators are trending down.
· Strength relative to the S&P 500 Index remains negative.