

“Mario Draghi and Ben Bernanke have willingly opened the floodgates and allowed their respective printing presses run 24/7. No surprise here. This is all Central Bankers know how to do and it had been forecast by many (myself included).”
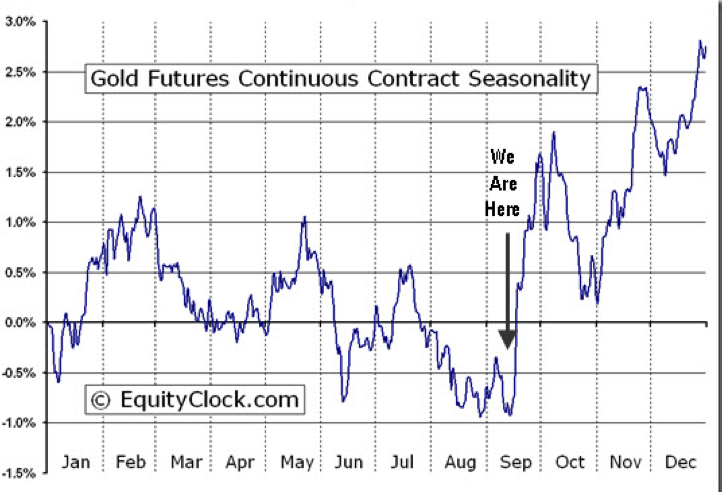
“My Annual Forecast Model (below) along with Equityclock.com’s ‘seasonal’ studies all pointed to the time band from mid-summer forward as being friendly to the metals. So, for now, we need to sit back and enjoy it!”
“Depending on which forecast chart you look it, it is clear we’re overall headed higher. However, there is theoretical ‘cyclical’ risk of a pullback both here in September and again in October. Use pullbacks to establish or to add to current positions if you don’t feel you allocation to the metals is great enough.”

Quote & Chart above from Mark Leibovit’s Hot off the Press Sept. 14th 25 page VR Gold Letter . IF YOU HAVE NOT SIGNED UP FOR THE LEIBOVIT VR GOLD LETTER, HERE IS YOUR CHANCE. HERE IS THE LINK: WWW.VRGOLDLETTER.COM. YOU GET A 50% DISCOUNT FOR THE FIRST MONTH.
Miners Catching Up To Metals — Huge Run
Coming?
Gold bugs are a generally happy bunch this week. But they’d be a lot happier if precious metals mining stocks kept up with the metals themselves. Since early 2011 the largest gold miners have underperformed gold by about 40%, while the junior miners have done even worse (I’m talking to you, Great Basin).
Thanks to this divergence between the metals and the miners, it was possible to clearly understand the monetary destruction endemic in the developed world, conclude that gold and silver were the places to be, make a decisive bet on this thesis — and still end up losing money.
There are two possible conclusions to draw from this: Either mining as a business has changed fundamentally and will be unprofitable forever – in which case we should just own physical metal and forget about paper proxies. Or the past couple of years were one of those inexplicable divergences from established relationships that produce huge gains when they snap back to normal.
The past month has offered a taste of what the second possibility might look like. The chart below shows that the big miners (represented by the GDX gold miner ETF, red line) have outperformed gold itself (the GLD bullion ETF, blue area) since July. But the two-year gap, like I said, is about 40%, so parity is still a long way off.
Now that the miners have some momentum, it wouldn’t be surprising if they made up this ground in no time at all.

Above by DollarCollapse.com managed by John Rubino, co-author, with GoldMoney’s James Turk
Perspective on the current Dow rally
The Dow made another post-financial crisis rally high Thursday on the news that the Fed will embark on a third round of quantitative easing (a.k.a. QE3). To provide some perspective on the current Dow rally, all major market rallies of the last 112 years are plotted on today’s chart. Each dot represents a major stock market rally as measured by the Dow — with a rally being defined as an advance that followed a 15% correction (i.e. a major correction). As today’s chart illustrates, the Dow has begun a major rally 28 times over the past 112 years which equates to an average of one rally every four years. Also, most major rallies (78%) resulted in a gain of between 30% and 150% (29.8% to 150.5% to be exact) and lasted between 200 and 800 trading days (9.5 months to 3.2 years) — highlighted in today’s chart with a light blue shaded box. As it stands right now, the current Dow rally (hollow red dot labeled you are here) which began in October 2011 (since it followed a 16.8% correction), would be classified as well below average in both duration and magnitude.

Notes:
Where’s the Dow headed? The answer may surprise you. Find out right now with the exclusive & Barron’s recommended charts of Chart of the Day Plus.


