

The “hoped for” short term stock market spurt triggered by a favourable resolution of the Fiscal Cliff has provided an opportunity to take profits on strength on a wide variety of seasonal trades (e.g. agriculture, technology, semiconductors, biotech) and to rotate into other sectors that have a history of outperformance during the January to April period (e.g. energy, platinum, copper).
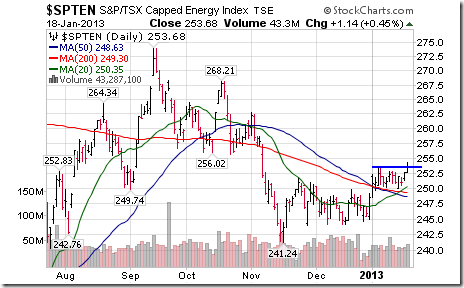
P.S. Nice breakout by the TSX Energy Index on Friday!
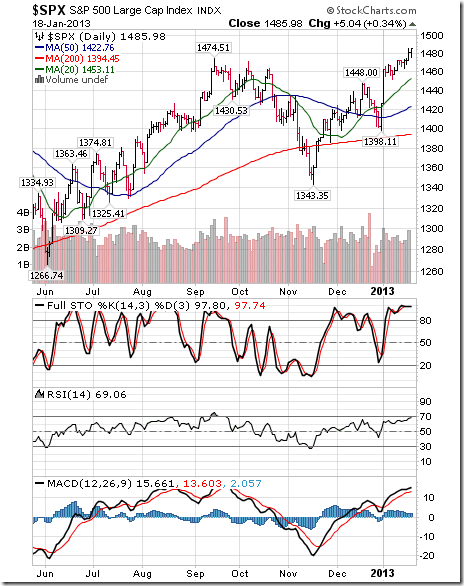
The S&P 500 Index added 13.93 points (0.94%) last week. Intermediate trend is up. The Index closed at a six year high. The Index remains above its 20, 50 and 200 day moving averages. Short term momentum indicators remain overbought.
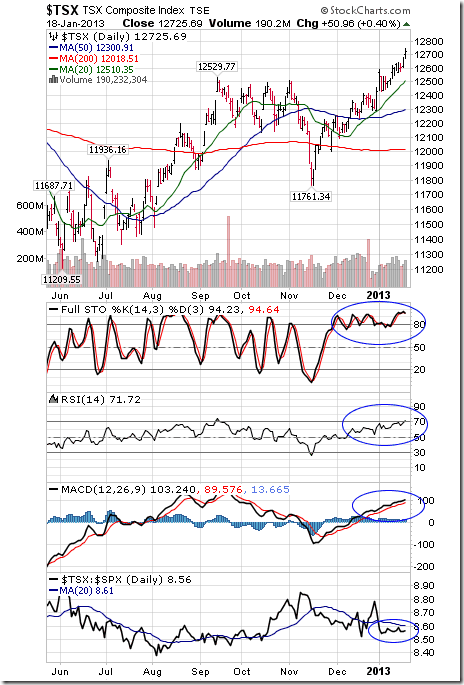
The TSX Composite Index gained 123.51 points (0.98%) last week. Intermediate trend is up. The Index closed at a 10 month high. Short term momentum indicators are overbought. Strength relative to the S&P 500 Index remains neutral. The TSX Composite Index has a history of outperforming the S&P 500 Index between the third week in January and the end of April.
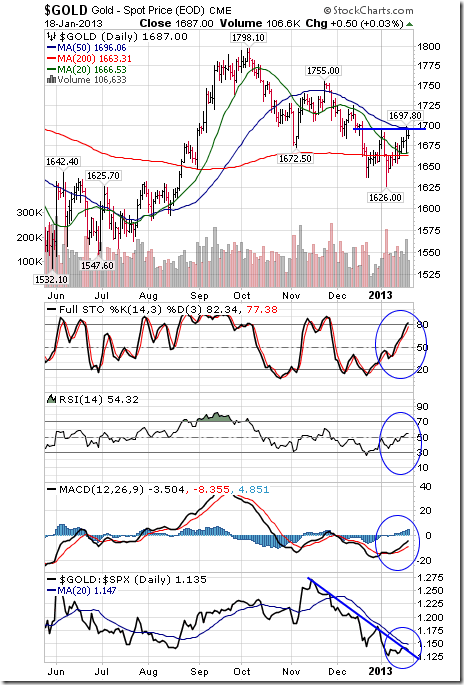
Gold improved $23.00 per ounce (1.38%) last week. Intermediate trend changed from down to neutral on a move above $1,695.40. Gold remains above its 200 day moving average and moved above its 20 day moving average. Short term momentum indicators are trending up. Strength relative to the S&P 500 Index is negative, but showing early signs of change.
Copper added $0.01 per lb. (0.27%) last week. Intermediate trend is up. Copper recovered back above its 20 day moving average. Short term momentum indicators are neutral. Strength relative to the S&P 500 Index is neutral at best.

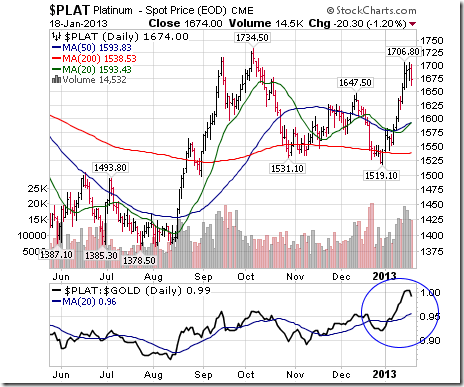
Platinum improved another $43.40 per ounce (2.66%) last week. Intermediate trend changed from down to up on a break above $1,674.00. Strength relative to gold remains positive
…..so many more charts & comments & Commentary HERE


