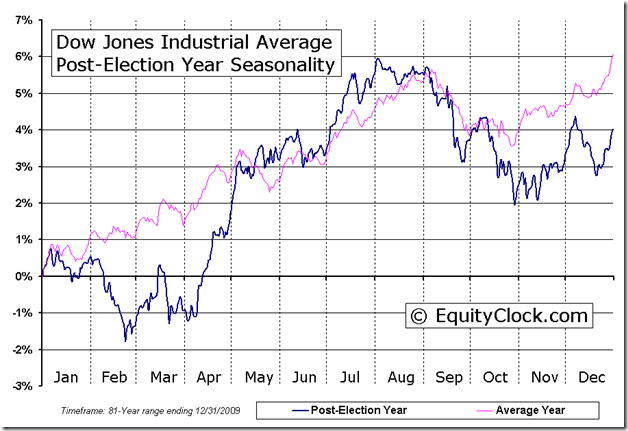
A shallow correction between now and the end of March will provide an opportunity to accumulate sectors on weakness that have a history of outperformance into spring. Sectors include energy, metals and mining, copper, platinum, retail, steel and auto & auto parts.

Selected equity markets around the world (e.g. most western European markets, Canada, Mexico) showed short term technical signs of weakness last week. U.S. equity markets for the most part have held in a relative tight trading range during the past two weeks and remain short term overbought.
U.S. equity markets have a history of reaching a short term peak at the end of the first week in February in the year following a U.S. Presidential election. Thereafter, they enter into a shallow correction lasting until the end of March. Thereafter, U.S. equity markets move higher. History is repeating this year.
Equity Trends
The S&P 500 Index added 2.86 points (0.01%) last week. Intermediate trend is up. The Index remains above its 20, 50 and 200 day moving averages. Short term momentum indicators remain overbought.

The TSX Composite Index fell 114.60 points (0.90%) last week. Intermediate trend changed from up to down on Friday on a break below 12,668.81. The Index remains above its 50 and 200 day moving averages, but fell below its 20 day moving average. Short term momentum indicators are trending down. Strength relative to the S&P 500 Index remains negative.

The VIX Index fell 0.56 (4.30%) last week to a six year low.

Precious Metals
Gold fell $57.40 per ounce (3.44%) last week. Intermediate trend changed from neutral to down on a break below support at $1,626.00. Gold remains below its 200 and 50 day moving averages and fell below its 20 day moving average. Strength relative to the S&P 500 Index remains negative. Short term momentum indicators are oversold.

Silver fell $1.59 per ounce (5.06%) last week. Intermediate trend changed from up to down on a break below support at $30.75. Silver remains below its 20 and 50 day moving averages and moved below its 200 day moving average. Strength relative to Gold changed from positive to neutral. Short term momentum indicators are trending down.

The AMEX Gold Bug Index dropped another 23.99 points (5.95%) last week. Intermediate downtrend was confirmed on a break below support at 385.20. The Index remains below its 20, 50 and 200 day moving averages. Strength relative to Gold remains negative. Short term momentum indicators are oversold.

The TSX Metals & Minerals Index fell another 12.15 points (1.25%) last week. Intermediate trend is down. The Index remains below its 20 and 50 day moving averages and above its 200 day moving average. Strength relative to the S&P 500 Index remains negative. Short term momentum indicators are oversold.

Commodities
Crude Oil added $0.14 per barrel (0.15%) last week. Intermediate trend is up. Support is at $94.97 and resistance is at $98.24. Crude remains above its 50 and 200 day moving averages and below its 20 day moving average. Strength relative to the S&P 500 Index remains neutral. Short term momentum indicators are trending down.

….read much more & view 37 more charts HERE


