

More evidence of shallow correction! Economic data released this week generally will show a slowdown in economic growth in the month of February
Earnings reports this week are not expected to have a significant impact on equity prices
Political influences on equity markets are diminished this week. Congress is on holidays. The next critical date is March 27thwhen a continuing resolution needs approval by Congress.
Short and intermediate technical indicators continue to show that at least a short term peak has been reached by most equity markets and sectors.
Cash hoards remain high, but are declining as companies announce dividend increases and share buybacks instead of capital spending.
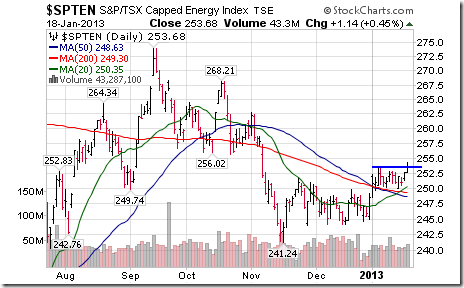
The Bottom Line: A shallow correction between now and the end of March will provide an opportunity to accumulate sectors on weakness that have a history of outperformance into spring. Sectors on the radar screen include energy, retail, steel and auto & auto parts?
With the exception of the Dow Jones Industrial Average and the Dow Jones Transportation Average which moved to new highs last week, most equity indices and sectors peaked between January 30th and February 20th. The peak coincides with average performance by the S&P 500 Index in a post-election year. History suggest that a shallow correction in equity markets has started that likely will last until the end of March/first week in April. (Special Free Services of charts below available through www.equityclock.com )
Equity Trends
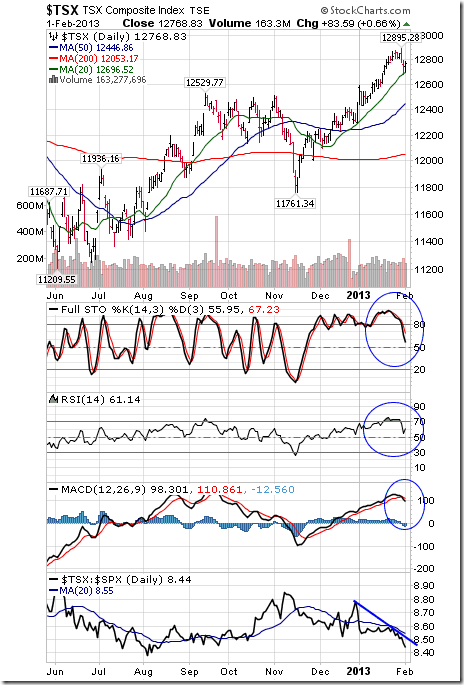
The TSX Composite Index gained 71.49 points (0.56%) last week. Intermediate trend remains down. Resistance is at 12,895.28. The Index remains above its 20, 50 and 200 day moving averages. Strength relative to the S&P 500 Index changed from negative to neutral. Short term momentum indicators have declined to neutral levels.
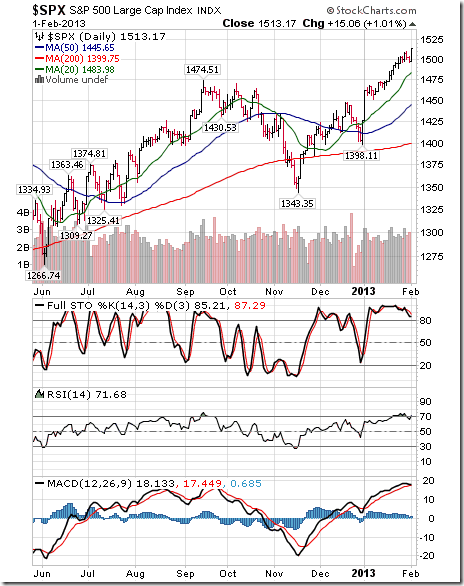
The S&P 500 Index added 2.60 points (0.17%) last week. Intermediate trend is up. Resistance is forming at 1,530.94. The Index remains above its 20, 50 and 200 day moving averages. Short term momentum indicators have declined to a neutral level.
….. Read it all & view 45 Charts HERE


