

The Bottom Line
Upside potential by North American equity markets into April remains, but many seasonal trades also expire around mid-April. Retention of existing seasonal trades makes sense. However, new seasonal opportunities coming into April are relatively sparse (An exception is the Technology sector). In most cases with seasonal trades, the question is “When to take profits”?
U.S. economic news this week is expected to be slightly bearish (Consumer confidence, New home sales, Weekly initial claims, Chicago PMI).
First quarter earnings reports come into focus starting this week. Most companies are in their quiet time. Only companies with negative surprises are likely to comment. Consensus is a year-over-year gain by the 30 Dow Industrial companies of only 3.1%. Consensus for the TSX 60 companies is no change.
Short and intermediate technical indicators for North American equity indices and most sectors are overbought. Some already are showing signs of rolling over. Another test by the S&P 500 Index of its all-time high is likely, but is not expected to show significant follow through.
Currencies remain a focus, particular with the crisis in Cyprus and its potential impact on the Euro and the U.S. Dollar.
Political concerns are not a factor this week. Congress is getting ready to go on their Easter holiday.
Trading activity will diminish as the end of the week approaches. Look for quarter end “window dressing” to impact selected securities.
Cash hoards remain high.
Ed Note: To read the comments and view the 50 Monday Morning Charts just click HERE. Otherwise a chart from each category below:
Equity Trends
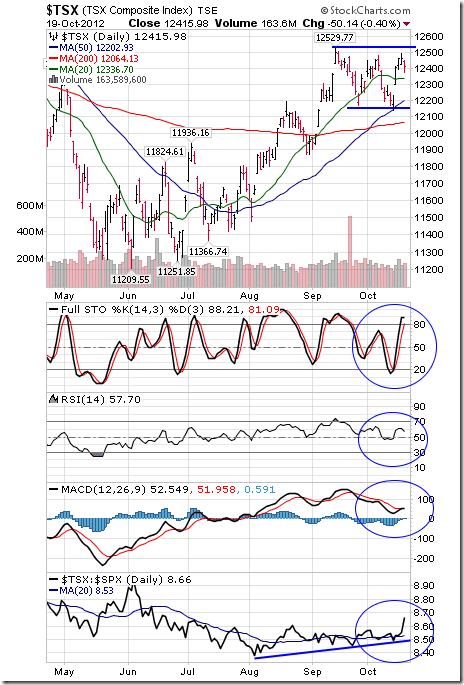
The TSX Composite Index slipped 72.67 points (0.57%) last week. Intermediate trend remains up. Resistance is forming at 12,904.71. The Index slipped below its 20 day moving average, but remains above its 50 and 200 day moving averages. Strength relative to the S&P 500 Index remains negative. Short term momentum indicators are trending down.
Currencies
The U.S. Dollar added 0.40 (0.49%) last week. Intermediate trend is up. The Dollar remains above its 20, 50 and 200 day moving averages. Short term momentum indicators are overbought and showing signs of rolling over.

Commodities
The CRB Index fell 1.74 points (0.59%) last week. Intermediate trend is down. The Index moved above its 20 day moving average. Strength relative to the S&P 500 Index remains negative, but showing early signs of change.

Interest Rates
The yield on 10 year U.S. Treasuries slipped 8.1 basis points (4.06%) last week. Yield fell below its 20 and 50 day moving averages. Short term momentum indicators have rolled over from overbought levels.

Other Issues
The VIX Index gained 2.27 (20.09%) last week.

Special Free Services available through www.equityclock.com
Equityclock.com is offering free access to a data base showing seasonal studies on individual stocks and sectors. The data base holds seasonality studies on over 1000 big and moderate cap securities and indices. Notice that most of the seasonality charts have been updated recently.
To login, simply go to http://www.equityclock.com/charts/
Following is an example, just click on the link:
Stock Market Outlook for March 25, 2013


