

The U.S. employment report on Friday helped to give a boost to world equity markets and most sectors. However, the employment report also brought concerns including higher interest rates, higher energy prices (crude oil, heating oil, gasoline) and a higher U.S. Dollar. Short term strength is not sustainable, particularly in front of mixed second quarter earnings reports and mixed third quarter guidance. Preferred strategy is to take advantage of short term strength in equity markets to take trading profits.
Selected sectors with favourable seasonality in the summer time need to be watched for entry points if they show signs of base building. Potential sectors include gold, energy and biotech. All already are showing positive strength relative to the S&P 500 Index.
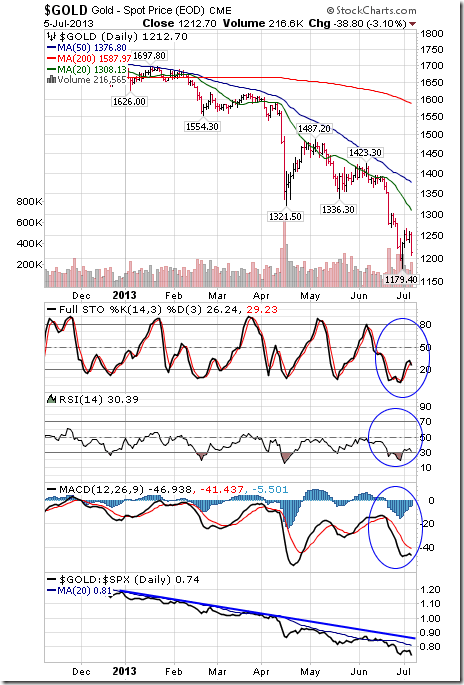
Gold fell $19.40 per ounce (1.23%) last week. Trend remains down. Gold remains below its 20, 50 and 200 day moving averages. Strength relative to the S&P 500 Index remained at 0.0 out of 3.0. Short term momentum indicators are trying to recover from oversold levels.
100 oz. Gold Futures Continuous Contract Seasonality
Analysis has revealed that with a buy date of September 13 and a sell date of May 23, investors have benefited from a total return of 128.74% over the last 4 years. This scenario has shown positive results in 4 of those periods.
The buy and hold return for the past 4 years was 87.94%.
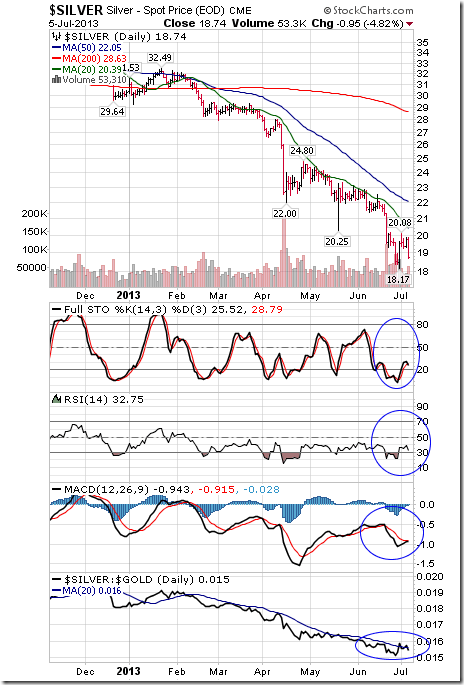
Silver lost another $0.82 (4.19%) last week. Trend remains up. Silver remains below its 20, 50 and 200 day moving averages. Strength relative to the S&P 500 Index and Gold remains negative. Technical score remains at 0.0 out of 3.0. Short term momentum indicators are trying to recover from oversold levels.
Silver Futures Continuous Contract Seasonality
Analysis has revealed that with a buy date of September 16 and a sell date of May 11, investors have benefited from a total return of 251.41% over the last 4 years. This scenario has shown positive results in 4 of those periods.
The buy and hold return for the past 4 years was 79.27%.
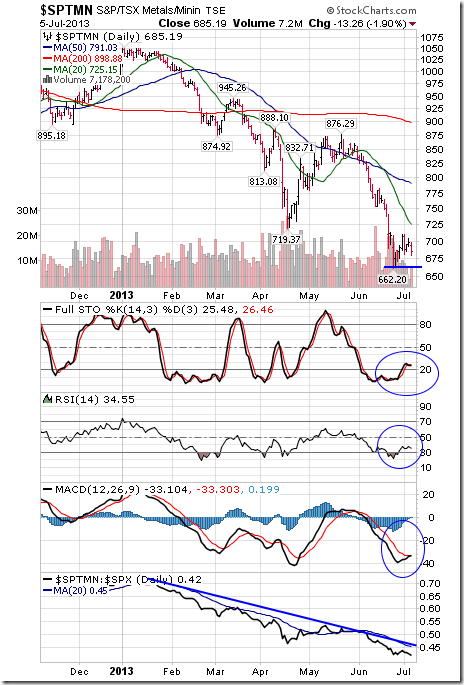
The TSX Metals & Mining Index fell another 20.37 points (2.89%) last week. Trend remains down. The Index remains below its 20, 50 and 200 day moving averages. Strength relative to the S&P 500 Index remains negative. Technical score remains at 0.0 out of 3.0. Short term momentum indicators are trying to recover from oversold levels.
Crude Oil gained $6.63 per barrel (6.86%) last week despite strength in the U.S. Dollar. Intermediate uptrend was confirmed on a move above $100.42 to reach a 15 month high. Crude remains above its 20, 50 and 200 day moving averages. Strength relative to the S&P 500 Index remains positive. Technical score remains at 3.0 out of 3.0. Short term momentum indicators are overbought, but have yet to show signs of peaking.
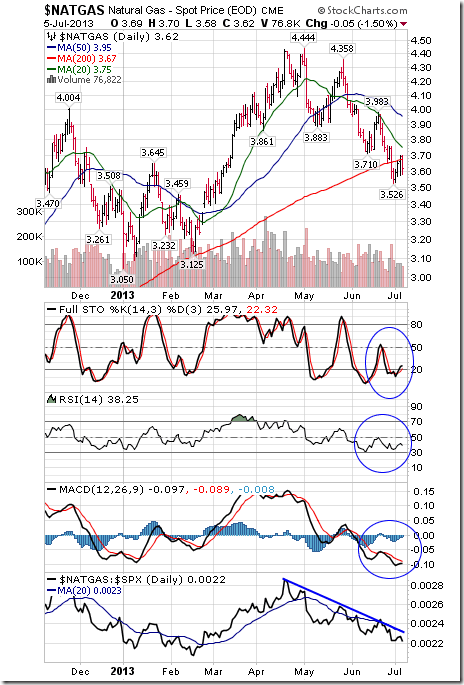
Natural Gas added $0.04 (1.12%) last week. Trend remains down. Gas remains below its 20, 50 and 200 day moving averages. Strength relative to the S&P 500 Index remains negative. Technical score remains at 0.0 out of 3.0. Short term momentum indicators are oversold.
…….so many more charts and commentary at Don Vialoux’s Timing the Market HERE
……seasonality at EquityClock including the Stock Market Outlook for July 8th HERE


