

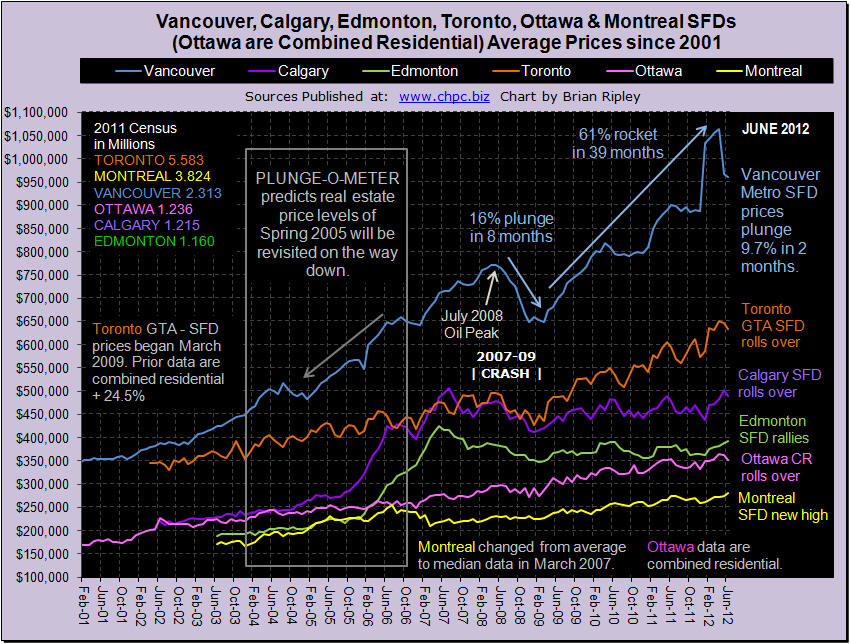
The chart above shows the detached housing prices for Vancouver, Calgary, Edmonton, Toronto, Ottawa* and Montréal (*Ottawa are combined residential). In June 2012 urban flippers met up with huge sales resistance across Canada (Scorecard) with double digit M/M drops of 29% in the Montreal condo market and 28% in Edmonton townhouses. Pricing power has been hit in the hot markets of Vancouver and Toronto (Plunge-O-Meter). SFDs have dropped 9.7% in Vancouver and 2.4% in Toronto in the last 2 months while Montreal SFDs hit a new record high and Edmonton continued their 5 month rally despite news of huge energy production gearing up in the Bakken (U.S.) and the Bazhenov (Russia). The 10yr less the 2yr spread widened by 5 bps against a 36 month trend of narrowing since May 2009; no big deal yet, but the last time this happened, the 10yr less the 2yr spread narrowed from Spring 2004 to Summer 2007 (similar duration as now) which set up the change to widening and the 2007-2009 crash. It’s an interesting comparison, buckle up.
Ed Note: Go to http://www.chpc.biz/charts.html to view individual City Charts


