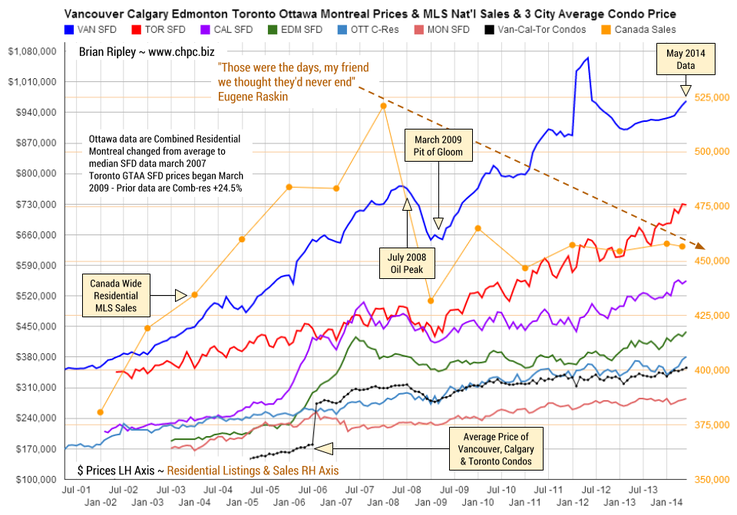
CANADA: Vancouver, Calgary, Edmonton, Toronto, Ottawa & Montréal Housing as well as National MLS Residential Sales and the Average Price of Vancouver, Calgary & Toronto Condos – For Larger Chart Go HERE

The chart above shows the average detached housing prices for Vancouver, Calgary, Edmonton, Toronto, Ottawa* and Montréal* as well as the average of Vancouver, Calgary and Toronto condo (apartment) prices (Left Axis). On the right axis is the MLS Annual Total Residential Sales across Canada. *Ottawa data are combined residential (Not SFD); *Montreal data are median SFD (not average) and usually not reported until 2nd week of the month.
In May 2014 Edmonton average detached single family, Toronto condos, Ottawa combined residential and Montreal median SFDs all hit new record prices although Montreal has been there a total of 5 times in the last 12 months.
The booming markets of Calgary, Edmonton and Toronto force intrepid bidders to scale the wall of disadvantage where vendors currently enjoy a 40-50% absorption rate and a +/- 2 month average listing life (MAR-MOI charts). Elsewhere it’s a grind.
Will the new “posted retail” 5 year fixed rate mortgage low of 4.79% drive the hunger games into overtime? (if you shop around you can get sub-3% on a 5 year fixed) Notice that the seasonally adjusted national MLS sales have plunged and are 12.4% below the 2007 peak.
It is interesting to note that the combined average price of a Vancouver, Calgary & Toronto condo is currently 25% more expensive than a median priced Montreal SFD and note also that in the spring of 2006, those 3-City average condos zoomed 58% in price (over $100,000) in just 3 months as the buy side of the market freaked out over the inversion of the 10yr less the 2yr spread as it went negative (Yield Curve).


