
Asset protection
 My belief is that the big surprise this year is that investor confidence in central banks collapses. And when that happens — I can’t short central banks, although I’d really like to, and the only way to short them is to go long gold, silver and platinum,” he said. “That’s the only way. That’s something I will do.”
“We simply have highly inflated asset markets. Real estate is high, stocks are high, bonds are high, art prices are high, and interest rates and short-term deposits are basically zero,” Faber said. “The only sector that I think is very inexpensive is precious metals, and in particularly precious-metals stocks.”
“It’s going to end in a complete disaster. But, we have to distinguish – the disaster may not happen for five to ten years. But we’re heading into an iceberg. And, what will eventually happen is that the population will suffer very badly from inflation and declining real wages.”
More from Marc Faber:
Marc Faber Warning : QE has Grossly inflated Asset Prices
The Central Banks will be exposed for All The Fraud they Commit

 Whether or not the Swiss National Bank was the “first domino to fall” remains to be seen. With central banks in Denmark, Turkey, India, Peru, and Canada all lowering rates and China pumping $8 billion into its banking system via a reverse repo operation, it’s clear that 2015 promises to see central banks be much more involved in managing an unwieldy financial system.
This morning we take a look at the European Central Bank’s €1 trillion QE plan – likely the worst kept secret in the financial system. With QE programs in the US and Japan offering mixed results at best, one wonders if ECB officials remember Albert Einstein’s words when he defined insanity as “doing the same thing over and over and expecting a different result”. The results, whatever they may be, could be constructive for higher gold and silver prices in 2015.
As always, thank you for taking the time to consider our ideas,
Chris
![]()


Stock Markets
Exuberance and Volatility continue to be the features of the stock markets. This week’s violence suggests that the Resolution Phase has become irresistible. Will resolving the excesses be moderate as in October, or cyclical?
We have reviewed that momentum and sentiment number have twice reached levels only seen at cyclical peaks in the stock market. At year-end the Bulls minus Bears number had increased to 41.5%, which compares to the 45.4 notched in June. Anything above 40 can be dangerous.
The highly-regarded John Hussman has reviewed valuations by P/E and concluded:
“One might as well be investing on a dare.”
Liked the turn of words, but this valuation is high, but not as high as in 2000 and in 1929.
Of course, the “dare” has been that the Fed’s former bond buying program would prevent bad things from happening. This was backed up with Draghi’s boasting that the ECB would soon start the bond buying. We thought that in lieu of actual buying his tout about “buying” would have to be repeated at least twice a day to keep the faithful in.
There are a few salient points that seem to be overwhelming policymaker ambition.
As if on schedule, credit spreads reversed in June and had become very concerning in the middle of December. After correcting until year-end, widening has resumed. This will likely continue and as it does it will remind that the Fed has no (repeat no) control over credit spreads.
There is no official control over the yield curve as well and it seems to have reached a technical excess at year-end. Let’s put it this way – flattening has been a positive and steepening at the end of a bubble has always been a negative.
Another point is that the intention of reckless policy has been to drive commodities up, making business more prosperous. Our commodity index, which does not include gold, set its high at 470 in 2011 and it has set a new low for the bear at 261 this week.
Of course, the charts provide dispassionate adjudication of the ambitions of policymakers, investors and traders.
We have using the NYSE Comp and the STOXX to monitor the big “Rounding Top”.
As noted last week, the pattern for the NYA has been replicating that of 2007. For the STOXX the replication includes 2007 and 2000. The key to both breakdowns was taking out the 50-Week ma at – strangely enough – the end of the year. So far this week and on a Weekly basis the price range is trading both sides of the ma at 3149. Of interest was that the year-end 2000 failure of the 50-Week was followed by a two-year bear. The year- end failure in 2007 was followed by a 15-month bear.
On the first week of the year, STOXX took out the 50-Day and 200-Day moving averages. The rebound was stopped at the 50-Day and could not reach the 200-Day, which is weak action.
The NYA accomplished a modest Rounded Top in 2000 (big action was in the Techs). It took out the 50-Week ma in January of that fateful year and declined to late 2002. The next such failure was in December 2007 and that decline ended in March 2009. The 50- Week is at 10706 and at 10532, the key long-term moving average has failed.
The near-term pattern is similar to that of the STOXX.
For both, taking out the December lows would do a lot of damage and taking out the Octobers lows would say “Game Over!”.
Within the swings the August decline registered a Springboard Buy and subsequent volatility gave two Hindenburgs. December’s decline ended with a Springboard Buy, which has now provided two Hindenburgs.
What could limit the senior stock indexes to a correction of just 10 percent?
Perhaps the limit to the last correction was provided by October’s ability to clear problems? We know that “everyone” was playing the October to May seasonality and that drove equities to another unsustainable condition.
More investors are becoming aware of the full implications of weakening commodities. Last week’s Pivot noted that the plunge in crude was getting overdone and thought that “the action can take a pause”. Which with copper’s plunge getting overdone as well could release a rally in the senior indexes.
Makes intuitive sense, but Ross has noted that crashes in crude have been followed by generally weak stock markets. Some bounces are possible but the financial markets are more precarious than they were in October.
Credit Markets
As noted above, credit spreads changed towards adversity in June which was on schedule. We had thought at some time the curve would also change, but the mania in yields made that call uncertain. However, one rule seems to be coming in. Typically a boom will run some 12 to 16 months against a flattening curve. In 2000 and 2007 the curve inverted, but some expansions have ended without inversion.
December was Month 12 on the count and this places the curve in the window of probable change. So let’s look for change. Using the twos to tens (UST2Y/TNX), flattening has become dynamic with a big swing in the Daily RSI from 29 a year ago to 72. This is the most dramatic rush of flattening since mid-2008.
This could take a little more work, but the curve is now providing a warning on change.
Spreads widened out to 210 bps in the middle of December and narrowed to 197 bps at the end of the month. It is now at 211 bps and providing another warning on contraction.
The seasonal rally for the bond future came through and was enhanced by declines in commodities and equities. We had thought that treasuries could rally up to “ending action” and as the saying goes “Are we there yet?”.
Within the spirit of avoiding precision, we are almost “There”. The Monthly RSI is up to 71 and above 70 has been rare. The last one peaked in November 2008, which was a sharp rally with the worst part of the Crash. This bond rally has been part of the financial party since December a year ago.
Also very much part of the party have been European bonds. Except for those of Russian and Greece. The German 10-year continues to set new lows for the move. Now at 0.408 percent. It is mainly the same in Spain with the yield now down to 1.60% after visiting 1.51% last week. As an example of a mania, the yield has declined from 6.78% with the Euro Crisis that completed in July 2012. There was a brief and modest correction from March to May 2013. Otherwise no correction in almost 2 years.
Much the same holds for other European bonds. A paucity of corrections.
Commodities
The concept that the Fed can depreciate the purchasing power of the dollar at will seems not to be working.
As determined by the CRB, commodities have declined by declined by 41 percent since 2011. We don’t call gold a commodity so we created our commodity index to not include gold. It has declined 45 percent on the same move.
The sell-off is becoming impetuous with the Weekly RSI on the CRB down to 11. On a chart back to 1980 it has never been this low. Perhaps a brief rally will correct the excesses.
The main depressant has been crude oil with a big weighting and a big decline. The Weekly RSI is down to only 9. Last week’s view was that the decline could “take a pause”.
Oil stocks (XLE) registered an Upside Exhaustion in June. The high was 100 and the low has been 72 in December and 71.7 yesterday. Crude’s December low was 53.60 and the low for the move was 44.20. Stocks have been outperforming the product.
While both could enjoy a pause in the decline, it is worth noting that at 45 crude was back to the price level of April 2009. At the slump to 72 the US Oil Patch (XLE) compares to the level of 45 set in April 2009.
In Canada the XEG is back to the 2009 level and that is despite the 15 handle drop in the Canadian dollar.
Perhaps the big integrated oil companies are providing the cushion, but how long can it last? The Oil Patch could suffer a multi-year contraction as suffered by the Precious Metals.
Precious Metals
The action in the Precious Metals Sector continues to be constructive. Gold shares have been outperforming the bullion price and the silver/gold ratio has improved a little.
Of particular interest is that despite this week’s strength in the dollar, gold’s dollar price has increased. This could be confirming our “New Paradigm” theme whereby gold outperforms most other price series during a post-bubble deflation. This is more obvious in each of the recessions.
The “Old Paradigm” whereby the evil Fed depreciates the dollar and gold goes to “$5,000” is hopefully shelved. The “Goldbug” story began to get legs in the 1960s when macroeconomists became aggressive in their theories that through clever manipulations they could eliminate the business cycle.
Despite the endless drumbeat about the Fed there was not one long bull market in gold’s dollar price. There were two. From 35 in the 1970 to 850 in 1980. Then from 255 in 2001 to 1895 in 2011. The following chart shows the calls based upon the gold/silver ratio.
Relative to commodities, gold’s real price continues to advance, which will eventually enhance profit margins for the industry. It will also enhance valuation of gold deposits.
Our advice has been to accumulate gold stocks on weakness, but we do not have a full position yet.
Ampersand
At the Christmas lunch with our favourite exploration company there were some “stories”. One was about a prospector coming to town and wearing his best suit which was medium grey. But it seemed to have “circles” in the fabric. This was a puzzle until someone figured out that he was putting the suit beneath the mattress overnight to keep it pressed. Coil springs.
All bear markets are the worst in history and in one in the early 1980s I recall talking to a mining broker and saying that “What the Vancouver market really needs is a good discovery”.
“Yes, but they have been holding back on those lately” was the response.
Link to January 16 Bob Hoye interview on TalkDigitalNetwork.com:
http://talkdigitalnetwork.com/2015/01/swiss-franc-shocks-currency-markets/

-
- Whenever the RSI on the silver/gold ratio soars to 80 or higher it indicates excessive speculation.
- In 1987 our research noticed that the silver/gold ratio changed before the magnificent blow-off in January 1980.
- We have been using it since.
- In 2011 the RSI on the ratio reached 92. The only other example occurred with
the 1980 peak. - The next speculative surge took it to 84 in September 2012.
- The last “Sell” was in June 2014 when the RSI reached 84.
 Today the man who remarkably predicted the collapse of the euro against the Swiss franc just 45 days ago shares more shocking predictions for 2015 with King World News. This interview takes a trip down the rabbit hole of central bank lies and deception and eventual collapse.
Greyerz: “Eric, what a day. Currency wars in 2015 are starting with a massive capitulation of the Swiss National Bank. As I have predicted for months, the SNB finally released the peg between the euro and Swiss franc at 1.20. This caused massive moves in the currency markets as well as massive losses for the Swiss National Bank….ie the Swiss National Bank has just suffered losses of 80 Billion Swiss Francs – that’s over 10% of Swiss GDP.

 Remember this day – Wednesday, January 14th, 2015; as it may well be recalled as a key inflection point in financial history. I had planned on writing of just one “historically momentous” event – i.e., last night’s implosion of base metal prices, signaling the “death of manipulation” of the illicitly supported copper market. However, before I even started writing – at 8:40 AM EST – no less than seven such events littered the global economic and financial landscape.
Actually, I had planned on also highlighting the utterly insane manipulations of yesterday’s markets – as the PPT desperately attempted to prevent the “Dow Jones Propaganda Average” from plunging; whilst the Fed desperately attempted to prevent the 10-year yield from closing below the October 15th “flash crash” low of 1.89%, yielding universal realization of the “most damning proof yet of QE failure”; and the Cartel desperately attempted to slow the momentum of the past two weeks’ explosion of PM prices, particularly in non-dollar currencies. Suffice to say, the piddling “salvation” achieved by yesterday’s efforts has been decidedly annihilated this morning; as care of said “historically momentous” factors, stocks, commodities, and interest rates are plunging; whilst currency markets are in chaos; and what do you know, gold prices are surging – as silver, a day after another enormous sales day at the U.S. mint, is also looking extremely strong.
And thus, in no particular order, here are today’s “historically momentous” events; which, cumulatively, will make it eminently difficult for TPTB to prevent universal realization of a far more terrifying sort; i.e., that “2008 is back.”
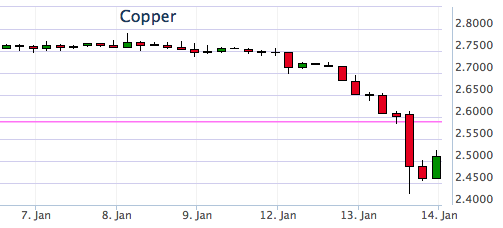
1. I could kick myself, as for the past week I’ve queued up an article topic, discussing the irrationality of copper and zinc prices holding up so well, whilst the Bloomberg Commodity Index plunges to a 12-year low. Moreover, in the case of “Dr. Copper” – the poster child of industrial commodity demand; or as I called it last year, “Dr. Death” – it is also amidst a horrific Chinese inventory scandal. In other words, it was just a matter of time before copper “met its maker.” And finally, after gradually weakening over the past week, it suddenly collapsed last night, along with zinc and all the base metals. Down 5% today alone, to $2.57/lb, it is now down 11% from the $2.90/lb level it ended 2014 at; whilst zinc is now just $0.92/lb, from $0.99/lb at year-end. Both metals have a long way to go to the $1.25/lb and $0.50/lb lows of 2008, respectively, but rest assured they’ll probably come close. And when they do – and the Bloomberg Commodity Index makes multi-decade lows, not only will BHP Billiton and Rio Tinto again teeter on bankruptcy, but the “Miles Franklin Silver All-Star Webinar Panel’s” forecast of a 25%-50% silver production decline will appear far more likely.
2. After plumbing 20-year lows for the past year, mortgage purchase applications exploded 24% last week alone; and refinancing applications, an incredible 66%! And no, this is NOT “good news”; but instead, the “sum of all fears” regarding U.S. consumer and Federal insolvency.
To wit, I spent the New Year’s holiday in Arizona with a very close friend, who said he has just refinanced his mortgage. When questioned, he said Quicken Loans now sends email “alerts” whenever rates fall enough to warrant a new mortgage, with no material costs to complete the process. Immediately after completion, he receives a letter from Fannie Mae, reiterating their ownership of hits mortgage, and the perpetual refinancing process starts anew, as Quicken prepares its next email “alert.” Frankly, I was in awe – realizing that this, in fact, is a new form of QE, as the government is directly “giving” money to the public; thus, indebting it further, whilst adding massive debts to the Federal balance sheet. Which, by the way, is conveniently hidden from view, as Fannie and Freddie’s nearly $6 trillion of nationalized debt is held “off balance sheet.” Throw in the 3%-down mortgages the FHA is now offering to subprime lenders, and you can see the Fed’s printing presses have decidedly not been “tapered” – nor its appetite for financial destruction. Of course, you can bet that few, if any, of the 24% increase in mortgage applications will actually turn into new home purchases. Or, for that matter, that the waves of refinancing will cause Americans to “spend” – as opposed to paying off other debts.
3. In my “2015 predictions,” I forecast “Retail Armageddon” following this year’s historically horrible holiday spending season. Additionally, in yesterday’s “things I’m grateful for,” I noted my incredulity in seeing the MSM and Wall Street continue to expect holiday spending to be “salvaged” despite an 11% plunge in “Black Friday” weekend sales. Well, just this morning, that illusion was decidedly shattered, when it was reported that December retail sales not only plunged by 1.0%, compared to expectations of just a 0.1% decline. Thus, the oil price plunge has decidedly NOT acted as a “tax cut”; as not only evidenced by the shockingly bad retail sales, but plunging load factors at airlines like American Air! And oh yeah, even “excluding gasoline sales,” retail sales still declined.
4. The Fed may have succeeded in closing the 10-year yield at 1.89% yesterday, mere tenths of a basis point above the October 15th “flash crash” low. However, this morning it is in FREEFALL – touching at low as 1.78% earlier this morning, and sitting at 1.81% as I speak. In other words, the market is now fully “front-running” QE4, expecting it sooner rather than later; or as I’ve deemed it, the inevitable “Yellen Reversal.” And not only here, but throughout the world – as evidenced by the Japanese five-year yield yesterday joining those of Germany and Switzerland in negative territory. I mean, can you imagine the insanity of paying the world’s most insolvent entities for the right to lend them money? I can, as “investors” are simply betting the BOJ, ECB, and SNB – among others – will monetize such bonds at still higher prices. Of course, whilst investors rush headlong to the “safety” of QE-supported sovereign bonds – no matter how insolvent their issuers – they are fleeing “2008-style” from the debt of insolvent corporations!
5. Speaking of the ECB, the Euro has plunged to another nine-year low this morning – of 1.174 at its low. “Coincidentally” before next Tuesday’s potentially momentous ECB meeting, the highest EU court essentially gave a green light to the constitutionality of QE. Thus, gold is again surging in Euro and Swiss Franc terms, as the orchestrated three-year “bear market” is decidedly OVER. It’s only a matter of time before gold in Euros, Swiss Francs, Japanese Yen, and countless other currencies join Ruble-priced gold at all-time highs; and ultimately, as I’ll discuss in tomorrow’s Audioblog, U.S. dollar-priced gold.
6. Also on the topic of CRASHES, how about Bitcoin? Down another 20% overnight – to a low of $172 – it is now down 40% this year alone, and 85% from the all-time high set barely a year ago. I’ve written exhaustively of my views on Bitcoin; and frankly, the concept of alternative currencies, whilst intriguing, has a LONG, LONG way to go, even if ultimately successful. That said, Bitcoin will NEVER meet the parameters of money ; and sadly, countless tens of thousands are finding that out the hard way.
Nor, for that matter, are mining stocks – which despite the potential for material gains, are still just shares of ownership of companies hoping to profitably mine gold and silver, amidst a “minefield” of industry and government-erected obstacles. Just look at the massively dilutive financing announced yesterday by one of the industry’s “best” miners – Yamana Gold – causing its price to plunge 13% yesterday alone. In said “2015 predictions,” I also forecast complete paralysis of the global gold and silver mining industries, from already devastated levels – and that was before the base metal implosion I started today’s article discussing. Recall, roughly two-thirds of all silver production emanates as by-product from other types of mines – for the most part, copper or lead/zinc.
7. Though not momentous today, we are but eleven days from the potentially historic Greek snap election – in which the “anti-austerity” (read “pro-default”, “anti-Euro”) Syriza party is expecting a dramatic victory. Seeing its leader, Alexis Tsirpas, claiming Greek economic data is dramatically overstated – whilst government tax receipts collapse, as citizens anticipate a “debt jubilee,” it’s awe-inspiring to see the “revenge of the people” movement I anticipated in action.
Well, that’s enough for this “historically momentous” day; other than to conclude with this news of the ongoing explosion of global physical gold demand – which will inevitably go parabolic when, likely much sooner than most can imagine – the entire world realizes the end game of history’s largest fiat Ponzi scheme, “QE to Infinity,” is not just inevitable, but imminent.
PROTECT YOURSELF, and do it NOW!


-
I know Mike is a very solid investor and respect his opinions very much. So if he says pay attention to this or that - I will.
~ Dale G.
-
I've started managing my own investments so view Michael's site as a one-stop shop from which to get information and perspectives.
~ Dave E.
-
Michael offers easy reading, honest, common sense information that anyone can use in a practical manner.
~ der_al.
-
A sane voice in a scrambled investment world.
~ Ed R.
Inside Edge Pro Contributors

Greg Weldon

Josef Schachter

Tyler Bollhorn

Ryan Irvine

Paul Beattie

Martin Straith

Patrick Ceresna

Mark Leibovit

James Thorne

Victor Adair