
Asset protection

On the final day in April, we have seen shares rally across the board and not just in Asia. Two major markets were closed today for national holidays and so volumes are traditionally quiet on these occasions. However, we saw a stunning +1.74% return for the Hang Seng as a broad based rally consumed much of the talk. Tech, financials, real estate and the weekends Korea headlines all helped to this strong performance. Japan and China main were off today, but we did see Yen continue to trade lower against the USD even with the late correction in US stocks. SENSEX opened well and kept its bid for the whole day, strong performance. More consolidation for the INR around mid 66’s… CLICK for complete article

 In recent years, increased access to personal and business data has provided rich deposits of decision analytics there for companies to mine if they understand their value and know how to access them. Ignoring such a valuable resource is naïve and potentially hazardous to business owners and stakeholders.
Collecting, collating, processing and analyzing massive and complex data repositories will often be referred to as business intelligence. These data mining applications and processes are part of strategic intelligence that, in its totality, drives and informs corporate business decisions and strategies and can play a significant role in risk management.
However, there is more to consider… CLICK for complete article


A UGM-109 Tomahawk missile detonating above a test target in 1986 –
President Donald Trump threw down the gauntlet Wednesday morning by telling Russia to prepare for a US missile strike on Syria in response to a suspected chemical weapons attack blamed on the Syrian government. According to Martin Armstrong long as the Dow doesn’t close below 23509.06 this will just be another opportunity to buy stocks at a lower price during a panic – R. Zurrer for Money Talks
- A Russian diplomat had previously threatened to shoot down US missiles, and the platforms firing them, if the US attacked Syria.
- But the Kremlin has urged caution, trying to talk the US down from a strike on Syria.
“Russia vows to shoot down any and all missiles fired at Syria. Get ready Russia, because they will be coming, nice and new and ‘smart!'” Trump tweeted. “You shouldn’t be partners with a Gas Killing Animal who kills his people and enjoys it!”
….also from MarketWatch@ 6:21am PST: Dow poised to drop more than 200 points as Syria, White House tensions simmer
After rallying last Friday, the Dow tanked over 450 points this Monday, rallied more than 1,000 points Tues/Wed/Thurs then tanked another 572 points today. That’s volatility and this analyst has some advice on how to survive in this violent action – R. Zurrer for Money Talks
Have you been experiencing a sickening feeling? The kind you get when a plane hits some unexpected turbulence, or when the roller coaster you’re on takes that high drop?
That’s volatility.
Some people like that feeling – if they’ve chosen to be on a roller coaster. Of course, they’ll come out just fine on the other end of the ride with big smiles on their faces. They might even run to get back on line for another trip.
But if you’re investing in the market, volatility is nothing to enjoy. And definitely not something to wish for.

This column is less an energy update than something far broader in scope. But I can’t ignore the bigger picture surrounding oil and oil stocks and still have any chance of getting the smaller picture right, and volatility is currently swamping out everything else in the energy markets.
Volatility isn’t a disease, it’s a symptom. It’s a symptom with a number of possible diagnoses, like a chronic cough is for a person. You might have a cold – or it could be something much worse. But one thing for sure, a chronic cough is not something to wish for, nor is it something you’d be smart to ignore.
Since the market highs in late February, we’ve had a very violent correction from some understandable sources: The big and long-awaited corporate tax cut was passed. A changeover in the Fed chairman signaled a slow but steady rise in interest rates. The dollar began to gain strength from its lows.
But we’ve also seen some added pressures that have been unexpected: A retreat from global trade agreements in Asia and North America. An unending turnover in White House staff. Saber-rattling in North Korea and Iran. A 1950’s-style energy advocacy towards coal. And, most recently, an unprovoked threat of a full-on trade war with China.
My job isn’t to measure the politics of these pressures – although most of them seem entirely unnecessary – it is to measure how they are likely to impact our investments in oil and gas stocks.
Volatility is a sign of insecurity – and it’s almost always a negative sign. So, whether the markets happen to be up today, you shouldn’t feel all that much better about your oil and gas investments – not while we’re in the midst of such turmoil.
So, how do we handle this roller coaster ride? Well, in two ways – by limiting our exposure to higher-beta stocks and increasing it towards more blue chip dividend producing shares. In the end, we want to be increasing our cash position as well.
This has been my mantra for the past several columns and, if anything, gains even more volume after the action of the previous week. Despite the very strong fundamentals that I see in high-beta, Permian focused shale players, now is not the time to be adding to positions – in fact, most rallies in these shares should be seen as opportunities to lighten up on them. They SHOULD NOT BE ABANDONED – only shaved. Concurrently, downdrafts in the market should be used to add to positions of a few key dividend-safe majors. I have particularly favored the Euro-majors like Total (TOT) and Shell (RDS.A) for the better part of a year, and they have performed far better than their U.S. counterparts.
In this way we will be minimizing the effects that this new trend of huge volatility has been having, and likely will continue to have on our oil and gas stocks.
And maybe come out smiling on the other end of this roller coaster ride.
By Dan Dicker Oilprice.com

Bottom line, Golds inability to break the $1360/70 barrier for nearly two years including multiple attempts recently, yesterday’s action indicates we sit on the precipice of a sizeable downswing – R. Zurrer for Money Talks
Gold soared yesterday, likely based on the escalation of the trade conflict between the U.S. and China, but after several hours the rally was over. The tensions didn’t really subside, but the price of gold is already about $10 below the price at which it was trading when yesterday’s rally had started. Is gold trying to say something? No. It’s not saying – it’s screaming.
There is a combination of two factors that makes the current situation particularly interesting and meaningful. The first factor is what we already discussed in the previous alerts – gold’s decline was delayed because new bullish fundamental news kept emerging. We wrote that eventually there would be no new bullish news and that the price of gold would move back to its default mode and resume its decline.
The second factor is that if a given market no longer reacts to factors that should trigger a specific kind of reaction, then it’s a clear sign that the market is about to move in the opposite direction. Yesterday’s session in gold showed exactly that – gold should have rallied, and it did – but only initially. There was not enough buying power to keep pushing gold higher. In fact, buyers were not even able to prevent gold’s decline in the final part of yesterday’s session. Today’s pre-market downswing (gold is at about $1,325 at the moment of writing these words) confirms that the buying power (at least temporarily) almost dried up.
Combining the two previous paragraphs gives us a picture in which gold is not only unwilling to rally substantially based on positive news – it’s not even likely to rally temporarily based on them. It means that both: gold’s next move is likely to be a sizable downswing and that the time for the consolidation is up or almost up.
Before we move to charts, we would like to explain how the market tends to react if it really wants to move in one way (here: decline), but the fundamentals keep interrupting it (here: bullish fundamental gold news – news that’s bullish from the fundamental point of view). We’ll not going to explain a sophisticated econometric model for this and we’ll not going to use terms as first derivative or diminishing marginal returns. Instead, we’ll use a simple analogy to something from real life. It will not be a pleasant analogy, but if it generates any emotions, then it’s more likely that it will be easier to keep in mind.
Think of a hardcore drug addict. They have to keep on getting more and more of their “stuff” to keep them happy. They have to constantly increase the amounts of drugs that they take to get the same effect. Even though the final effect is the same – they get their “enjoyment” – the cause is only the increase in dosage. If they didn’t increase it, they would get smaller effects up to the point when it would not be noticeable. If they stop taking the drug at all (eventually, they are likely to run out of it, or their health is too damaged), their “enjoyment” turns into a nightmare.
Similarly, the price needs more and more bullish news to keep on rallying and at some point, the same amount of news (or the same importance of them) will start to generate smaller and smaller rallies. It would take more dramatic and more bullish pieces of news to trigger the same upswings. If the bullish news dosage stays the same, the price will rally at a slower pace and finally stop to rally at all. Once the bullish news is gone (or we have bearish news), the rally turns into a decline.
Yesterday’s session in gold likely shows the final stages of the above cycle and the implications are very bearish.
Having said that, let’s take a look at the charts starting with gold (chart courtesy of http://stockcharts.com).
Gold’s Daily Reversal
(click all charts below for larger images)
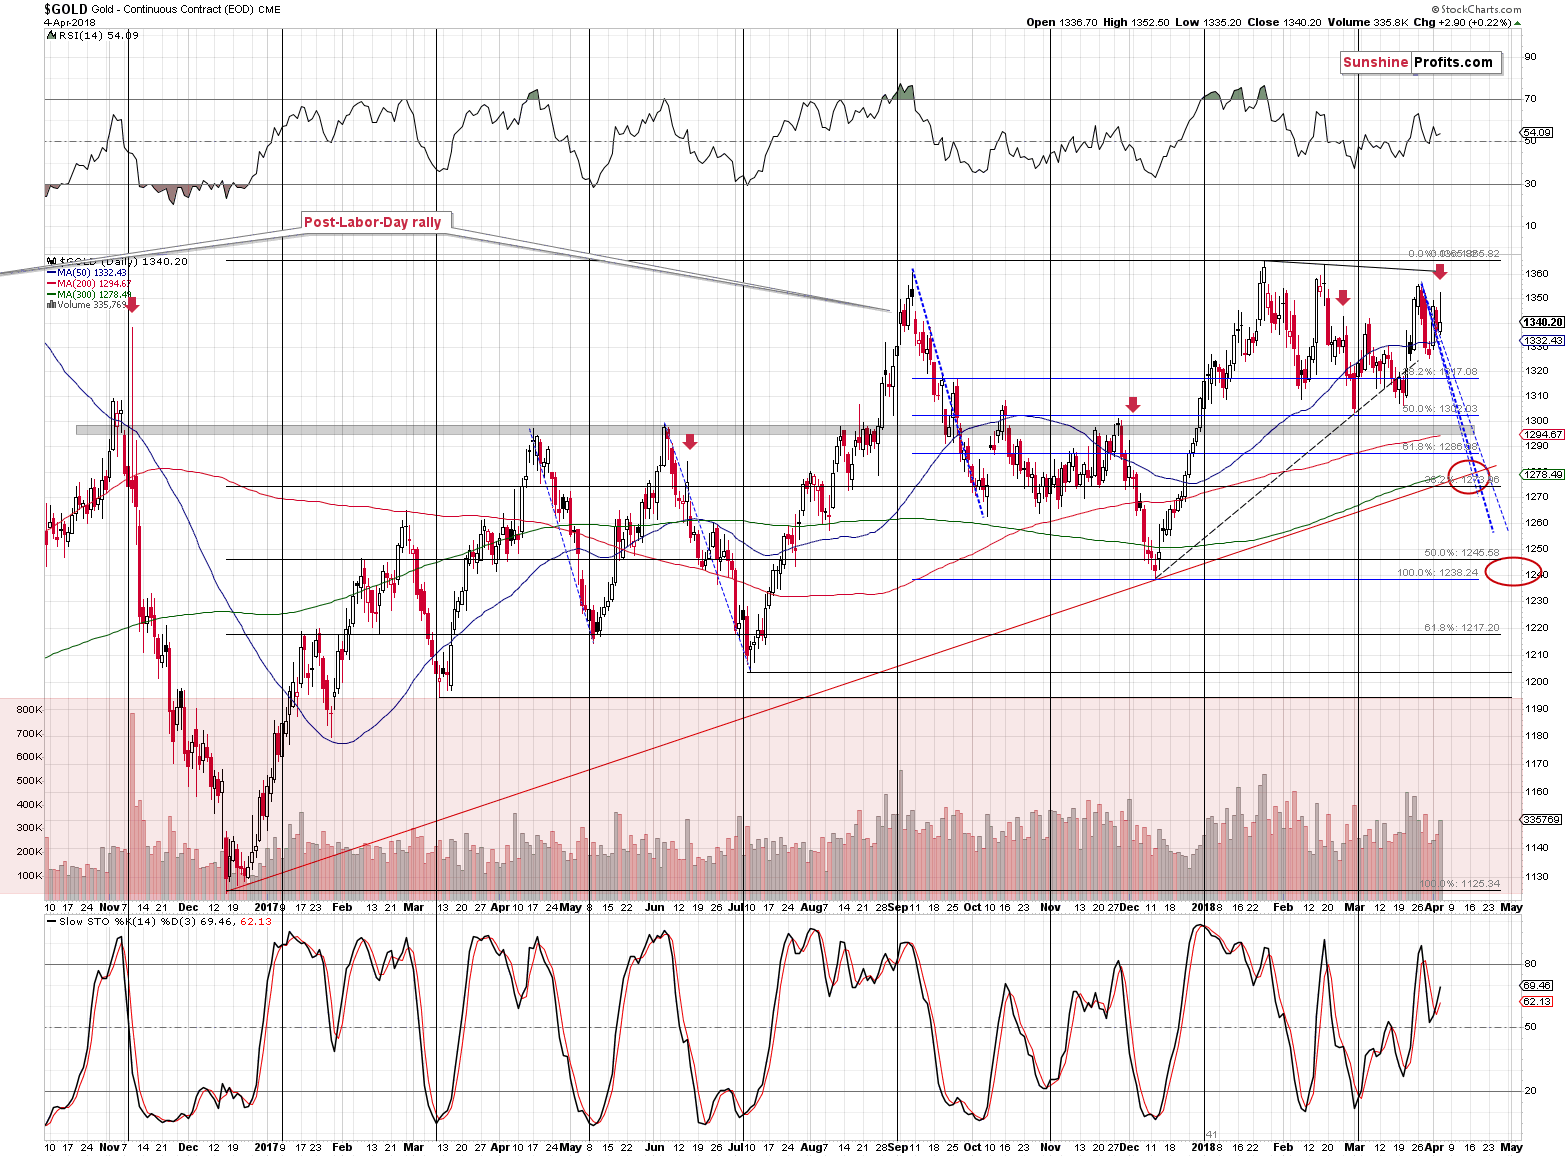
Technically speaking, gold reversed on significant volume, which is a classic sell signal. The implications are even greater than based on just the above, because we also have supporting analogies. Namely, this is the kind of reversal that we saw quite a few times before big slides, but after tops in terms of daily closing prices. We marked those cases with red arrows.
The most prominent example is early November 2016 and we can see the remaining ones (that are actually more similar to the current situation) in June 2017, on Dec 1, 2017 and in late February 2018. They were all followed by declines practically right away and it seems that today’s pre-market decline proves that history is repeating itself. It was not a good idea to be invested in gold back then, it’s doesn’t seem to be a good idea right now (except for the insurance capital, that is).
Silver’s Daily “Strength” Invalidated
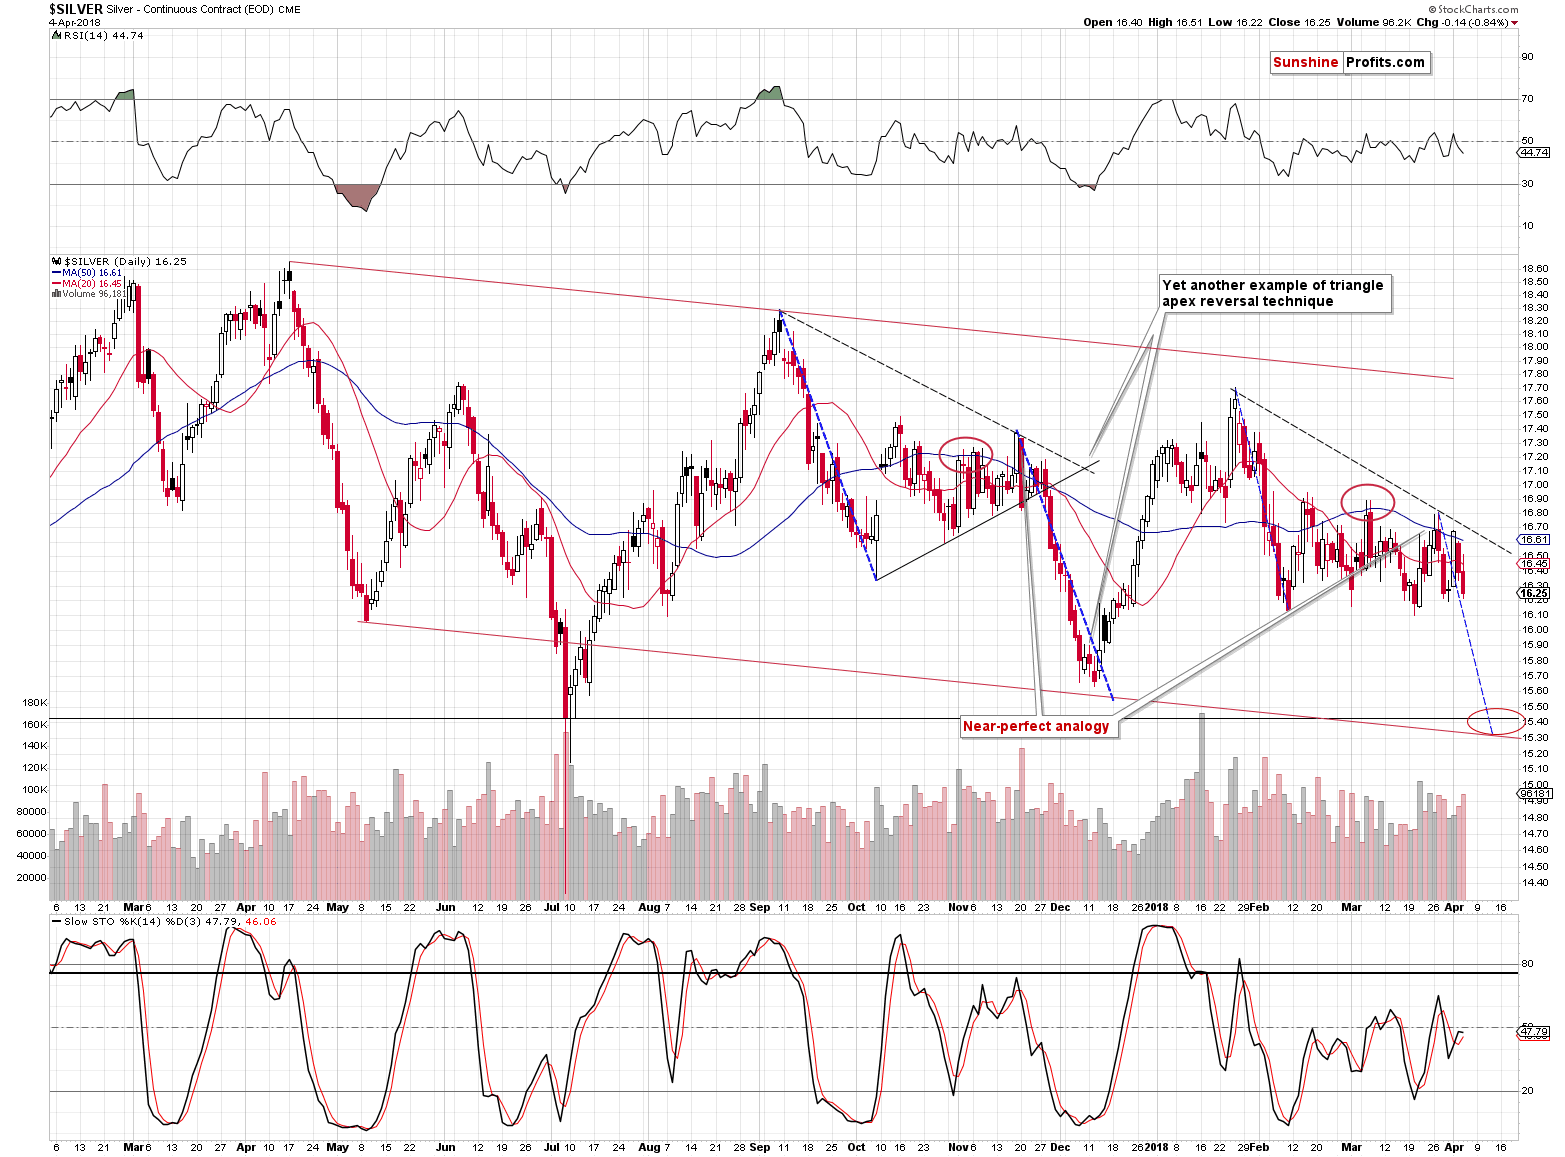
As you can see on the above silver chart, this week’s early strength is now fully invalidated. Actually, in today’s pre-market trading, silver even moved below the late-March low. In the previous articles, we warned you not to trust the silver upswing and it was indeed followed by lower prices practically immediately.
Please note that for more than a week, silver’s daily declines have been accompanied by volume that’s higher than what we have seen during daily upswings. The implications are bearish.
In terms of the analogy to the pattern that we saw from September 2017 to early December 2017, we are now likely in a situation similar to Nov. 28, 2017 – right before the decline.
Miners’ Underperformance Continues
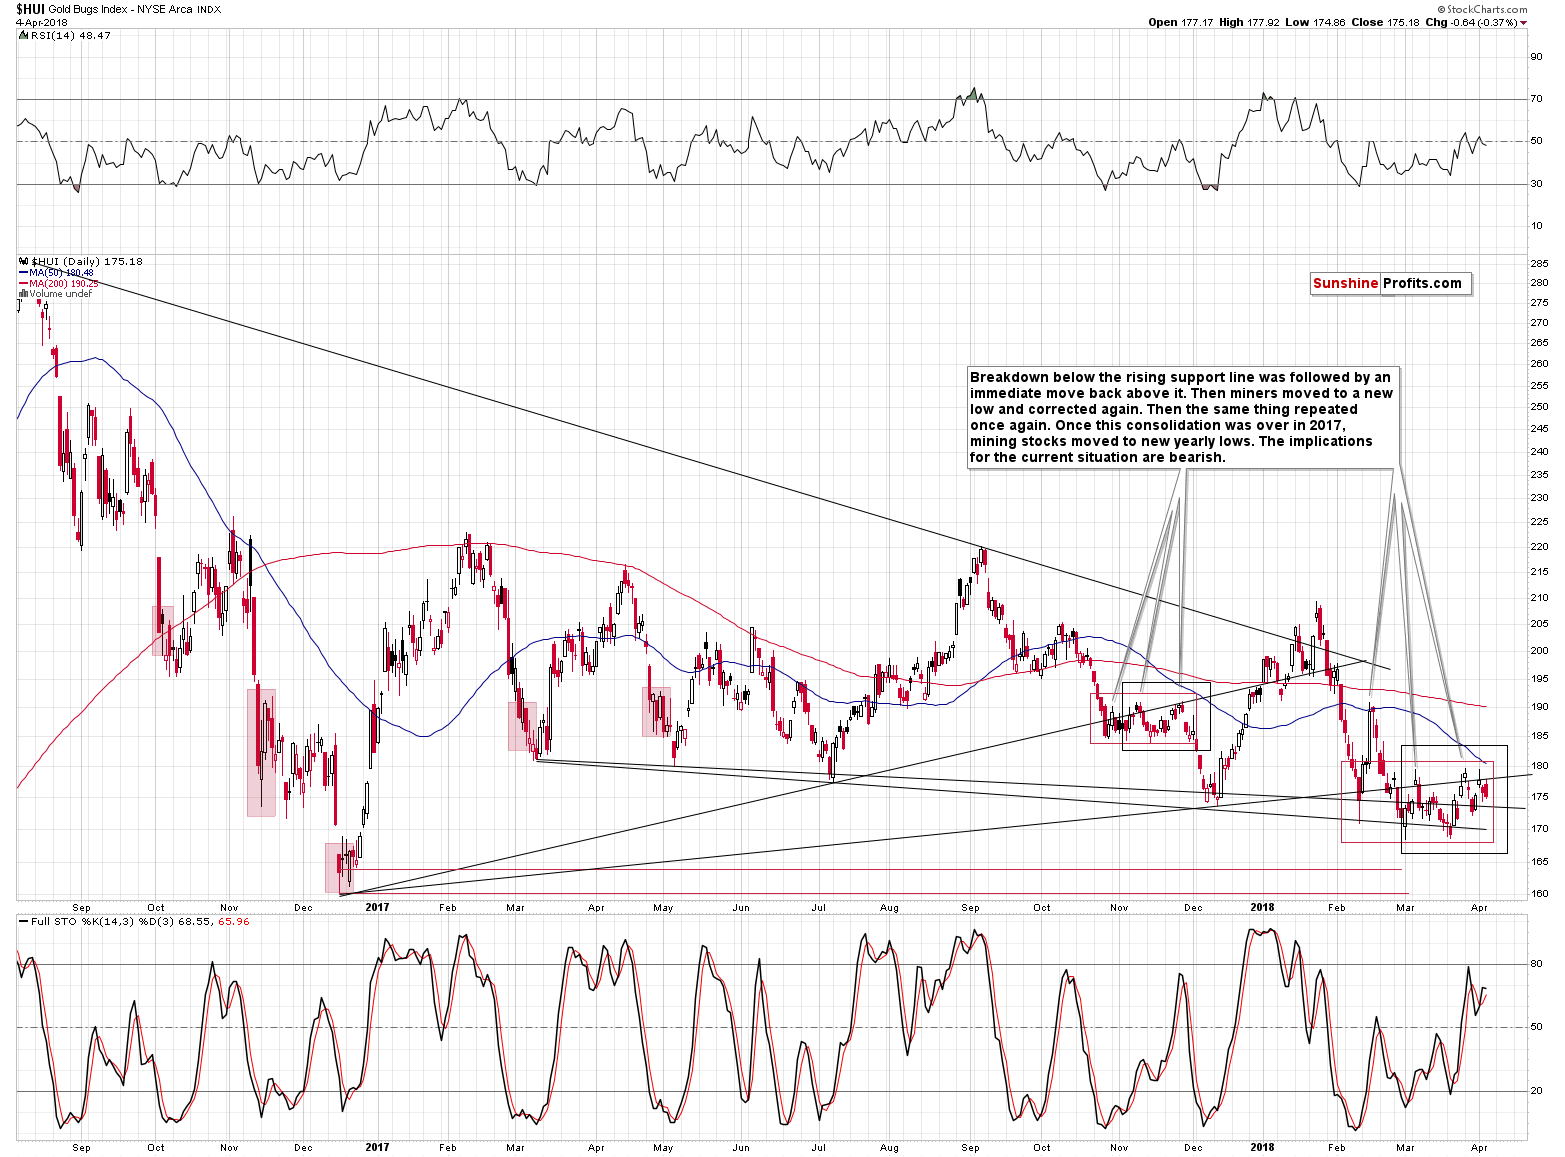
Even though gold moved a bit higher yesterday, gold stocks declined. That’s yet another clear sign of underperformance of the miners. The implications thereof remain bearish.
The EUR/USD Trigger
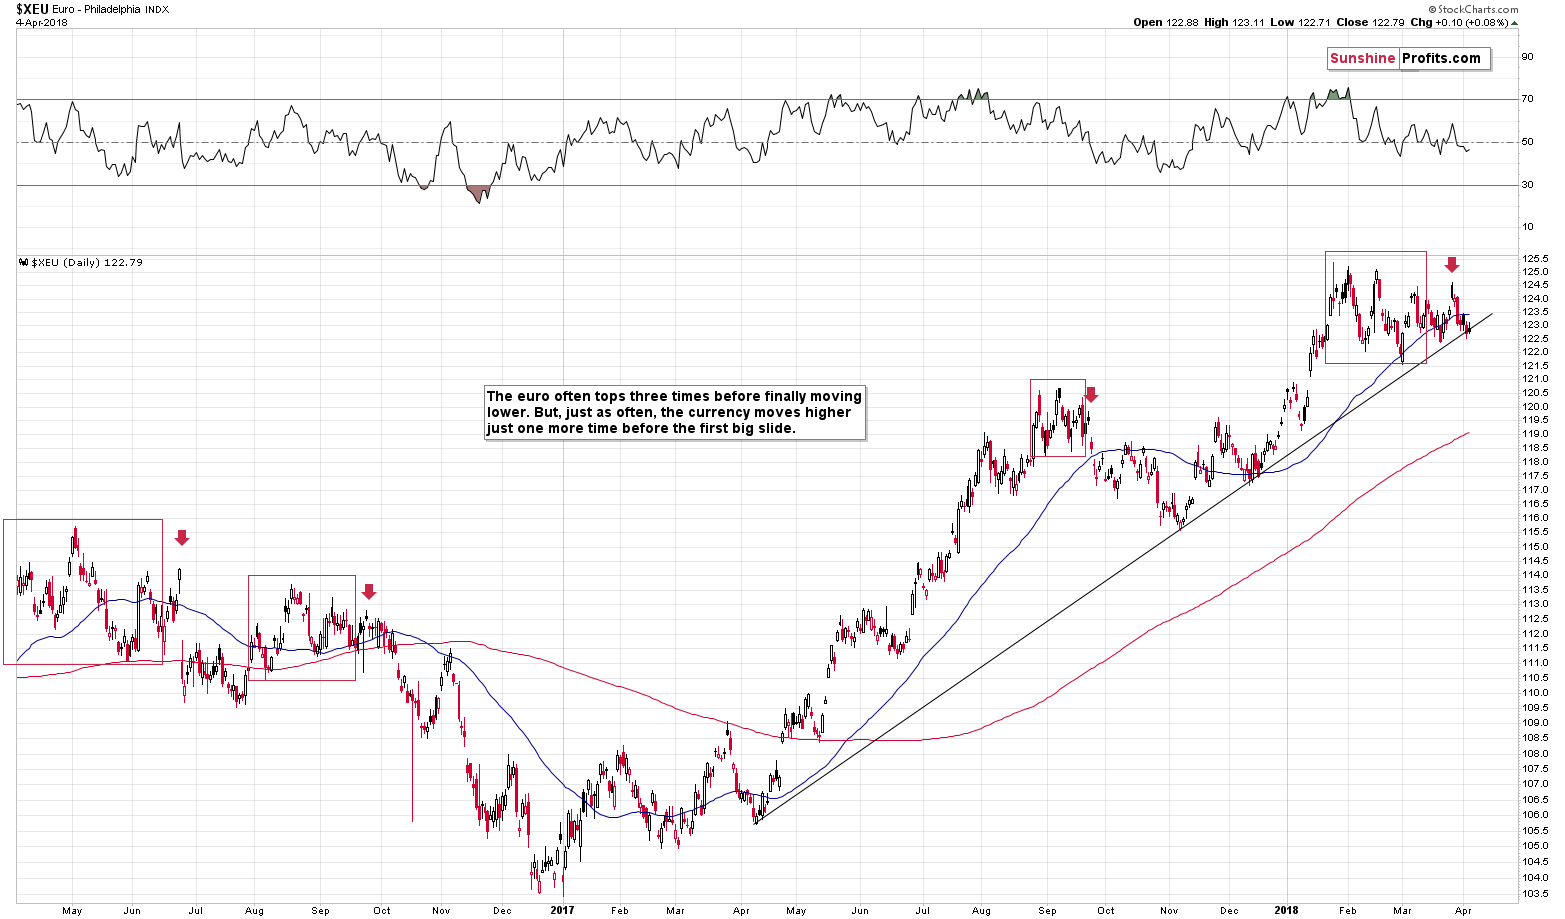
In yesterday’s alert we wrote that the situation in the EUR/USD currency pair remained tense and we wrote that it the pair was likely to break below its rising medium-term support line sooner rather than later. We wrote the following:
This support is what’s keeping the currency pair in check, which in turns keeps the USD Index in check. But, i.a. based on the triple-top formation it seems that we’ll see a big breakdown in the euro relatively soon. The implications are bullish for the USD Index and bearish for the precious metals sector.
The above remains up-to-date. The thing that we would like to add today is that despite the increased trade conflict tensions the USD’s value didn’t really decrease, which can be a sign that it really wants to move higher, not lower. That’s in perfect tune with our technical analysis of the USDX and also a factor supporting the scenario in which the EUR/USD pair breaks lower shortly.
Summary
Summing up, the fact that gold reversed its initial news-based rally is a very bearish sign for the following days and it suggests that the prolonged consolidation is over. Meanwhile, the next reversal date is looming, and it’s another reason that suggests that we’ll either see a decline shortly or that we’ll see more back-and-forth movement and a decline on April 9 or close to this date. The former is more likely at the moment. The Euro Index is on the verge of breaking lower, which is likely to push the USD higher and trigger a slide in the PMs. In other words, it doesn’t seem to be a good idea for one to keep a lot of gold in their portfolio at this moment.
Naturally, the above is up-to-date at the moment of publishing it and the situation may – and is likely to – change in the future. If you’d like to receive follow-ups to the above analysis (including the intraday ones, when things get hot), we invite you to subscribe to our Gold & Silver Trading Alerts.
Thank you.
Sincerely,
Przemyslaw Radomski, CFA

-
I know Mike is a very solid investor and respect his opinions very much. So if he says pay attention to this or that - I will.
~ Dale G.
-
I've started managing my own investments so view Michael's site as a one-stop shop from which to get information and perspectives.
~ Dave E.
-
Michael offers easy reading, honest, common sense information that anyone can use in a practical manner.
~ der_al.
-
A sane voice in a scrambled investment world.
~ Ed R.
Inside Edge Pro Contributors

Greg Weldon

Josef Schachter

Tyler Bollhorn

Ryan Irvine

Paul Beattie

Martin Straith

Patrick Ceresna

Mark Leibovit

James Thorne

Victor Adair