Asset protection
While participating in the asset orgy with all the other casino patrons, I’ve been building up a proportionally large position in cash equivalent SHV; boring old T-Bills. This allows the Fed to work for me as it hikes rates while mitigating/managing risk at the same time. One day scores of reformed substance abusers are going to come flying out of the casino into the likes of this cash equivalent along with gold, which will not be paying dividends like SHV, but will provide a whole other range of risk management services that are more important because they are off the grid (ya ya, I know… Bitcoin).

Subscribe to NFTRH Premium or the free eLetter
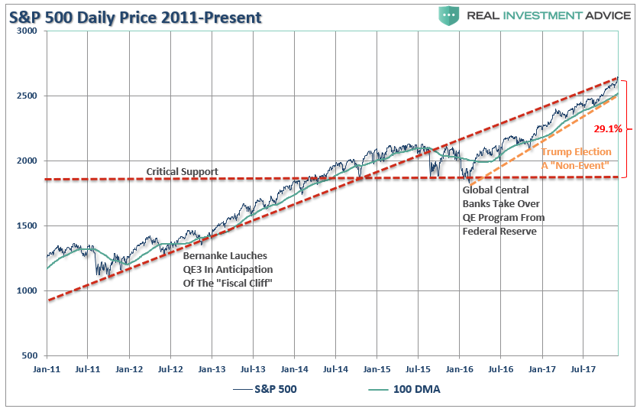
Since the election, markets have accelerated the pace of the advance, as shown in the chart below.

The advance has had two main story lines to support the bullish narrative.
- It’s an earnings recovery story, and;
- It’s all about tax cuts.
There is much to debate about the earnings recovery story, but as I showed previously, and to steal a line from my friend Doug Kass, this “new meme increasingly resembles ‘Group Stink.'” To wit:
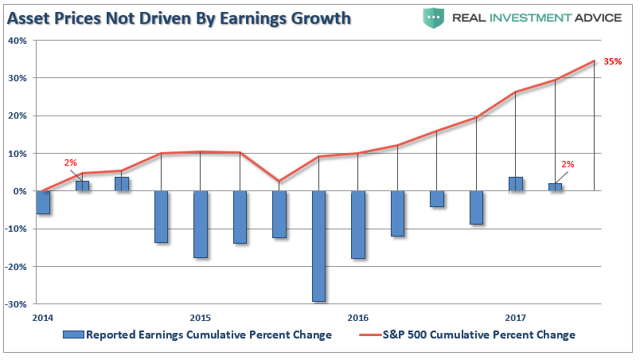
“Despite many who are suggesting this has been a ‘rational rise’ due to strong earnings growth, that is simply not the case as shown below. (I only use ‘reported earnings’ which includes all the ‘bad stuff.’ Any analysis using “operating earnings” is misleading.)”
“Since 2014, the stock market has risen (capital appreciation only) by 35% while reported earnings growth has risen by a whopping 2%. A 2% growth in earnings over the last 3-years hardly justifies a 33% premium over earnings.
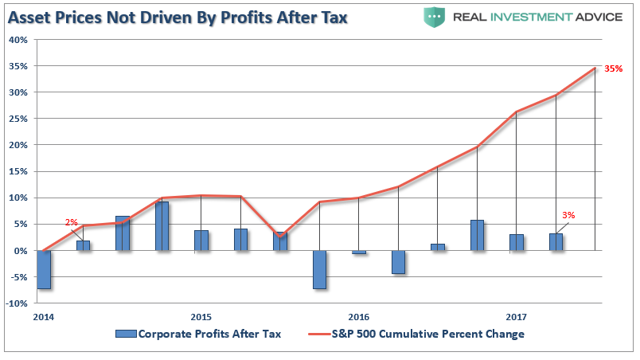
Of course, even reported earnings is somewhat misleading due to the heavy use of share repurchases to artificially inflate reported earnings on a per share basis. However, corporate profits after tax give us a better idea of what profits actually were since that is the amount left over after those taxes were paid.”
“Again we see the same picture of a 32% premium over a 3% cumulative growth in corporate profits after tax. There is little justification to be found to support the idea that earnings growth is the main driver behind asset prices currently.
We can also use the data above to construct a valuation measure of price divided by corporate profits after tax. As with all valuation measures we have discussed as of late, and forward return expectations from such levels, the P/CPATAX ratio just hit the second highest level in history.”
The reality, of course, is that investors are simply chasing asset prices higher as exuberance overtakes logic.
The second meme of “it’s all about tax cuts” is also not entirely accurate. The current rally, following the nearly 20% decline in early 2016, is actually an extension from the transition of “quantitative easing” from the Federal Reserve to the global Central Banks. What is clearly seen in the chart below is that as the Fed signaled the end of its QE program and begin hiking interest rates, global Central banks took the lead.
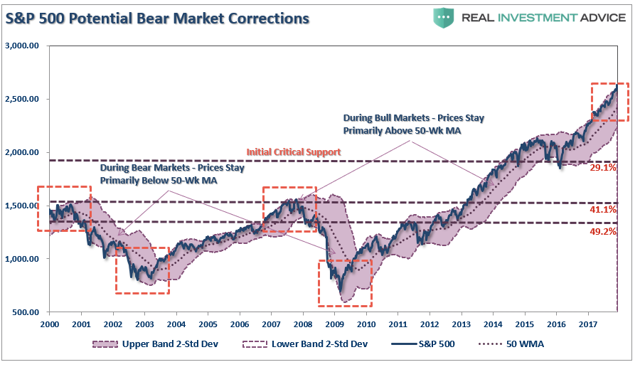
As noted, a correction back to critical support, the 2016 lows, would entail a 29.1% decline from current levels. More importantly, a decline of such magnitude will threaten to trigger “margin calls,” which, as discussed previously, is the “time bomb” waiting to happen.
Here is the point. The “excuses” driving the rally are just that. The election of President Trump has had no material effect on the market outside of the liquidity injections which have exceeded $2 trillion.
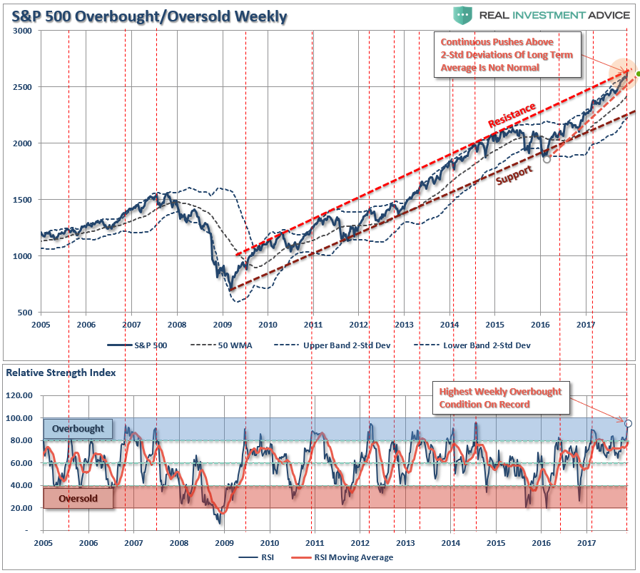
Importantly, on a weekly basis, the market has pushed into the highest level of overbought conditions on record since 2005. I have marked on the chart below each previous peak above 80 which has correlated to a subsequent decline in the near future.
The problem for investors is not being able to tell whether the next correction will be just a “correction” within an ongoing bull market advance or something materially worse. Unfortunately, by the time most investors figure it out, it is generally far too late to do anything meaningful about it.
As shown below, price deviations from the 50-week moving average has been important markers for the sustainability of an advance historically. Prices can only deviate so far from their underlying moving average before a reversion will eventually occur. (You can’t have an “average” unless price trades above and below the average during a given time frame.)
Notice that price deviations became much more augmented heading into 2000 as electronic trading came online and Wall Street turned the markets into a “casino” for Main Street.
At each major deviation of price from the 50-week moving average, there has either been a significant correction or something materially worse.
This time is unlikely to be different.
Just how big could the next correction be?
As stated above, just a correction back to the initial “critical support” set at the 2016 lows would equate to a 29.1% decline.
However, the risk, as noted above, is that a correction of that magnitude would begin to trigger margin calls, junk bond defaults, blow up the “VIX” short-carry and trigger a wave of automated selling as the algorithms begin to sell in tandem. Such a combination of events could conceivably push markets to either strong support at the previous two bull market peaks or to support at the 2011 peak, which coincides with the topping formations of 2000 and 2007.
Such a correction would entail either a 41.1% to 49.2% decline.
I won’t even mention the remote, but real, possibility of a nearly 75% retracement to the previous lows of the last two “bear markets.”
That can’t happen, you say?
It wouldn’t even match the decline following the 1929 crash of 85%.
Furthermore, as technical analyst J. Brett Freeze, CFA, recently noted:
“The Wave Principle suggests that the S&P 500 Index is completing a 60-year, five-wave motive structure. If this analysis is correct, it also suggests that a multi-year, three-wave corrective structure is immediately ahead. We do not make explicit price forecasts, but the Wave Principle proposes to us that, at a minimum, the lows of 2009 will be surpassed as the corrective structure completes.“
Anything is possible.
There are probabilities and possibilities.
Both can happen. You play the probabilities, but prepare for the possibilities.
No one knows with certainty what the future holds, which is why we must manage portfolio risk accordingly and be prepared to react when conditions change.
While I am often tagged as “bearish” due to my analysis of economic and fundamental data for “what it is” rather than “what I hope it to be,” I am actually neither bullish or bearish. I follow a very simple set of rules which are the core of my portfolio management philosophy, which focus on capital preservation and long-term “risk-adjusted” returns.
As such, let me remind you of the 15-Risk Management Rules I have learned over the past 30 years:
- Cut losers short and let winners run. (Be a scale-up buyer into strength.)
- Set goals and be actionable. (Without specific goals, trades become arbitrary and increase overall portfolio risk.)
- Emotionally driven decisions void the investment process. (Buy high/sell low.)
- Follow the trend. (80% of portfolio performance is determined by the long-term, monthly trend. While a “rising tide lifts all boats,” the opposite is also true.)
- Never let a “trading opportunity” turn into a long-term investment. (Refer to rule #1. All initial purchases are “trades” until your investment thesis is proved correct.)
- An investment discipline does not work if it is not followed.
- “Losing money” is part of the investment process. (If you are not prepared to take losses when they occur, you should not be investing.)
- The odds of success improve greatly when the fundamental analysis is confirmed by the technical price action. (This applies to both bull and bear markets.)
- Never, under any circumstances, add to a losing position. (As Paul Tudor Jones once quipped: “Only losers add to losers.”)
- Market are either “bullish” or “bearish.” During a “bull market,” be only long or neutral. During a “bear market,” be only neutral or short. (Bull and bear markets are determined by their long-term trends, as shown in the chart below.)
- When markets are trading at, or near, extremes, do the opposite of the “herd.”
- Do more of what works and less of what doesn’t. (Traditional rebalancing takes money from winners and adds it to losers. Rebalance by reducing losers and adding to winners.)
- “Buy” and “Sell” signals are only useful if they are implemented. (Managing a portfolio without a “Buy/Sell” discipline is designed to fail.)
- Strive to be a .700 “at bat” player. (No strategy works 100% of the time. However, being consistent, controlling errors, and capitalizing on opportunity is what wins games.)
- Manage risk and volatility. (Controlling the variables that lead to investment mistakes is what generates returns as a byproduct.)
The current market advance both looks and feels like the last leg of a market “melt-up” as we previously witnessed at the end of 1999. How long it can last is anyone’s guess. However, importantly, it should be remembered that all good things do come to an end. Sometimes, those endings can be very disastrous to long-term investing objectives. This is why by focusing on “risk controls” in the short term and avoiding subsequent major drawdowns, the long-term returns tend to take care of themselves.
Everyone approaches money management differently. This is just the way I do it.
All I am suggesting is that you do “something,” as the alternative will be much less beneficial.
 QUESTION: You have said that the future will be cryptocurrencies. The Bank of Canada has come out and acknowledged what you have been saying that such private issue challenges the government’s profit structure. Do you think electronic money will be viable sooner or later down the road?
PG
ANSWER: Electronic currency is ALREADY the bulk of the money supply. When you deposit $100 in a bank, it lends out $90 from your deposit and your bank statement still reflects you have $100. However, the person who borrowed the money now has $90 in their account. The government did not “print” money to cover that extra $90, rather they just created “electronic” money.
So what is the big thing about cryptocurrencies? The idea is that it is money that will not depreciate and is strangely not “fiat.” Yet, it is no different than the electronic money created by the bank, which is also outside the strict domain of government.
If you just look at the price of Bitcoin, it demonstrates that this is merely a speculative boom indistinguishable from the Dot.COM Bubble, which also reflected a new era in technology. If Bitcoin was truly an alternative currency that was supposed to retain its value, the mere fact that the rice has soared like any stock proves that it is by no means a “store of wealth” that somehow is better than currency in which it must still be converted to use in the bulk of the economy.
If the power grid failed, everyone would be broke. You could not even buy food. Society would revert immediately back to barter. There are risks to any form of electronic money be it a bank or crypto. The government WILL move toward cryptocurrencies THAT THEY WILL CONTROL, not the private sector. I have stated before, they argue electronic money eliminates cash crime from bank robberies, drugs, prostitution, etc., but it introduces more sophisticated hacking computer crimes.
The crime issue is the excuse, but the real issue remains the hunt for taxes. I have to wonder if the government is not behind this entire cryptocurrency phenomenon. Satoshi Nakamoto is the name assigned to this mysterious unknown person or people who designed Bitcoin and created its original reference implementation. Nobody knows who invented this technology. It is entirely possible that this movement is a false flag created by the government to move society to accept the end of tangible money. It is very strange that the person who invented this technology is unknown and has not stepped forward to demand some royalty.
…also from Martin:
It is always refreshing to step away from the keyboard for a few days and hit the “reset button,” which is exactly what I did last week. My wife and I took a quick trip to Mexico to get a little sun on our face while we wiggled our toes in the sand.
I came back astonished.
Over my 30-odd years of working with money in various capacities, I learned to “shut-up and listen.” This is particularly the case when you are in an airport lounge or packed like sardines in a missile-shaped tube hurling through the air at 35,000 feet.
People love to talk…if you let them.
I had a dozen “listening sessions” with a wide variety of people who each told me roughly the same thing summarized as follows:
- The market is a “can’t lose” proposition.
- So is “Bitcoin” (even though they had no idea what it really is when I asked them.)
- The market is only going higher from here because the Fed won’t let it go down.
You get the idea.
And just when I thought I was sure I had the most bullish views wrapped up – Kevin Matras fro Zack’s Research hit my inbox with the following:
“The S&P will double. And not just eventually. But over the next 5 years (or sooner).
Sounds like a Herculean task on the surface, but it’s really not. In fact, the market only needs to gain on average of 14.9% per year in order to do so. That’s not such a stretch given the market has been averaging 14.9% per year since this bull market began in early 2009, even though GDP (prior to this year) has only been increasing at an anemic 1.48% annual rate.
My 5-year doubling thesis also means that we won’t see another recession until stocks double again, nor will we see another bear market until stocks double again.“
So, there you have it.
No bear market until the market racks up another 2600 points and dwarfs every other economic growth cycle in history.
Meanwhile….Back On Earth
Before I go further, let me clarify one thing.
As a portfolio manager, I am neither bullish nor bearish. I don’t really care which way the market is headed personally. If it is rising, as it is now, I am long equities. When it reverses that trend, I will either be short equities and long bonds and cash.
That’s my job.
My job is also to pay attention to the risks that could quickly remove large chunks of investment capital from my client’s portfolios
The Perfect Storm Cometh
While politicians hammer out the details it is generally accepted that corporations and by extension the investor and asset owner classes are targeted for benefits under the coming Republican tax plan. The logical implication of that beneficial treatment is that barring a market meltdown in the interim, people looking to unload stock positions and take profits would tend to wait until January in hopes of gaining the 2018 tax benefit vs. 2017’s tax code.
Among the under performing sectors subject to tax loss selling in late 2017 I have selected the gold miners for this post because they tend to be counter-cyclical and “in the mirror” to the broad risk ‘on’ asset party currently ongoing. We have noted again and again that with the asset party in full swing the miners’ fundamentals cannot possibly look good, and at face value they don’t. Sector fundamentals like gold/oil and gold/materials ratios are not good and macro fundamentals like gold vs. stock markets, the economy (which is relatively strong) and the yield curve are not at all supportive either… as they currently stand.
In a perfect world stock market-to-gold ratios, long-term interest rates and the yield curve would work together to signal a time of change for the macro. The red shaded areas show a logical limit for stocks vs. gold, the 100 month exponential moving average has limited 30 year yields for decades and the yield curve is on the same message, heading toward but not yet to a logical limit.
Below is the current status of just one of the macro fundamentals we track, the 10yr-2yr yield curve. The reference to “Op Twist by another name & method” has to do with the curve flattening implications highlighted in this post on Nov. 20. The bond market manipulators led by Ben Bernanke announced an operation to buy long-term debt and sell short-term debt in 2011 with the expressed objective of sanitizing inflationary signals. Well boyz, job well done. The Goldilocks boom particularly, kicked in with the Semiconductor Equipment cycle that we first noted in early 2013.
I have no idea whether they actually named the new scheme, but if Treasury follows through on it they will be trying to continue pressuring the curve to flattening; in other words, trying to keep the good times going… because that is what politicians do and I have little doubt that Sec. Mnuchin is more politician than financial guy. This political guy has announced that he plans to issue more short-term bonds and less long-term bonds in order to rig the yield curve further as the Fed unwinds QE. Of course he is a buttoned down man of great wealth and good taste. He would never use the word “rig”… publicly. That is my word. Again, per the WSJ…
The Treasury’s new approach will shift some of that upward pressure on yields to shorter-term debt and away from longer-term debt.
In other words, the goals of the new operation are similar to Twist. The former rammed the macro into boom times and the latter would seek to keep it going. As noted in the post linked above, it seems pretty desperate. If things are so good, why continue flexing the manipulative arms of policy and government? Bueller? Anyone?
So the market can be manipulated but ultimately it will have its way. One wonders about the efficacy of a scheme overlaid on top of an already mature scheme of similar aims. Playing it straight here, the yield curve is, like stock to gold ratios, on its way but not to logical limitations. So for now, it’s party on Garth!
The job of a market manager is to manage the present as unemotionally as possible while looking ahead with sensible plans based on incoming and historical market data. The yield curve has been impulsively flattening, which is indicative of a boom or risk ‘on’ phase and an impairment of the fundamentals for gold and the gold stock sector. It’s just the way it is right now folks.
But what about next month or especially the month after that… or February? We have been cross referencing the above indicators and now can add in a fiscally imposed indicator as well in the form of beneficial changes to the tax code, for the wealthy, the investor class and corporate interests, at least. The stock market bull is going to be rudely interrupted at some point and the question is, at what point? Enter the indicators.
I believe the bull market will probably not end until the next deflationary u-turn, possibly at the 30yr yield limiter around 3.3%, stocks fully retraced vs. gold and the yield curve either inverted, flat or around the trend line noted above. The timing of those conditions can extend indefinitely since they are all big picture markers.
But on the short-term, an overbought stock market that has teased the bears with every little short-term twitch that resolves bullish may at least see the party interrupted if newly tax-unburdened players decide to unload early in the new year. Going the other way, the gold sector, current poor fundamentals and all, has three things potentially going for it…
- We are in the jaws of tax loss selling season for this under performing sector, and…
- The seasonal aspect for gold and the miners is constructive for a December or January secondary low, and…
- By definition, any interruption in the risk ‘on’ markets bull phase would favor risk ‘off’ gold and its counter-cyclical miners. US and many global markets are overbought and the US at least, has a new tax benefit wrinkle in the mix.
Let’s end with a look at the seasonal setup in gold and the miners as tax loss selling season progresses and tax gain selling season approaches. Gold’s 40 year seasonal average (Source: mrci.com) shows a corrective low in October/November ( ) and secondary lows in December and January. A literal interpretation (not recommended, but it is a frame of reference) is for strength from mid-December through January. Given the status of gold’s Commitments of Traders, it would be best to keep the bullish view restrained beyond January.
HUI checks in with a view of the 2014 and 2015 bear market years along with what may have been the first year of a new bull market, 2016. In all three cases the index bottomed in either November, December or January (also, let’s not forget 2017’s rally into mid-February). In the case of 2014’s November low, after a bottom retest in December a good rally followed into mid-March. In 2015 HUI bottomed in November, went sideways and had a surge in January. Those were bear market rallies and so, were limited after the seasonal played out.
2016, which I believe may have been the bear market low, bottomed in January and then impulsively worked its way upward until the over-hyped sector fell apart as its fundamentals degraded (in this post we used the gold/oil ratio as just one example).
Now, lest the above appear to be cherry picking of years, let’s expand HUI’s seasonal to 2008, so that we can smooth it out to include both bull and bear cycles. As you can see January and February have been the most bullish months with gains of 3.9% and 4.8%, respectively.
Bottom Line
A combination of a fiscal policy event (tax reform) and seasonal aspects could set up counter trend moves in the risk ‘on’ stock market and the much more risk ‘off’ gold sector. Noting the larger trends, if this comes about it could just be a counter trend move in the still bullish stock market and still bearish gold sector. It will depend on when the big macro signals register (they move oh so slowly).
My current tack is to remain balanced within stock market segments with some counterweight positions in quality gold stocks. Tax selling season is still in effect, so there could be some volatility near-term but there seems a pretty good potential of a shakeout of recent trends as we move into 2018. NFTRH will be charting the best gold stocks (per my view and especially per the views of trusted associates/fundamental sources) more intensively now, along with our ongoing regular coverage of broad markets and stocks. Consider an affordable membership ahead of time, rather than after the fact as we prepare for coming events.
By Gary Tanashian from Notes From The Rabbit Hole


