
Asset protection
 Sudden Event Would Be More than Enough to Spark Financial Crisis, Warns Faber
Many have expected a financial crisis in 2017. Some may have even hoped for one, thinking it would cause a big dent in President Donald Trump’s popularity. In August and September, as if taking a sigh of relief, investors pushed the pedal to the metal. For much of 2017, the markets have performed as if nobody even wonders, “Will there be another financial crisis?”
Ten years after the subprime crisis, the ever-crazier world of stock markets is on the verge of a new financial bubble. As it happens, it’s no time to consign stock market crash predictions to the closet of obsolescence.
Also Read: “Economic Crash 2017” and How Next Financial Crisis Could Be Worse than 2008

As investors, we have to determine the amount of risk compared to the amount of potential gain in any trade. Our job is to measure this relationship properly and to attempt to find opportunities in taking risks for an adequate amount of gain. Often, this business is difficult to manage expectations and presumed risk factors for traders. We’ve been trading, combined, for over 40+ years and have learned that the markets don’t always do what we expect them to do. A perfect example is our most recent VIX Spike call for Sept 9th ~ 12th. Even though our analysis was valid and accurate, we did not see the VIX spike levels we had projected to happen – such is life in the markets. We strive every week to deliver superior analysis, trading triggers/alerts and daily markets updates to our clients. Right or wrong, we live by our abilities to call successful trading triggers and provide timely and accurate market research.
Right now, a number of US major markets are setting up with divergence between price and common technical indicators. Because many investors fail to even review or focus on longer term charts, very few may be aware of these setups. Given the size and strength of the recent moves, we are not making predictions regarding the downside price potential (although it could be substantial). We are simply pointing out that these divergence patterns are setting up in a number of US major markets and we believe this is a significant correlation pattern of a future event.
This Daily NASDAQ chart provides one of the clearest examples of the divergence patterns. Price has continually tightened within an upward sloping trend channel and has recently formed a bear flag formation. MACD has related multiple divergence tops over the past 3+ months and RSI has hovered just above 45 throughout this trend to support the upward move. As washout high reversal early this week would be a perfect setup for a divergent reversal. A prices spike a bit higher early this week followed by a deep market correction.

This second chart of the ES provides even further evidence of the setup. This chart is a Weekly ES (S&P) chart that shows the divergent price action going all the way back to February/March of 2017. The cyan blue trend channel (support level) is clearly our potential downside target and the RSI is continuing to hover above 58 as this trend continues. Could the extended divergence be warning of a potentially massive correction? If so, the RSI would quickly fall to below 50 and price would attempt to retest the support channel (-200 pts from current levels).

The following chart of the INDU, again, shows the US majors are all setting up in a similar pattern. One can clearly see the continued divergence price pattern from early 2017 and the continued RSI support above 60. The confluence of these divergence patterns is causing us to be concerned of a surprise price rotation in early October. We’ve seen what we call a “washout price rotation” happen over and over in the markets near critical tops and bottoms. The telltale signs of these moves is extended weakness of a trend (as indicated by the MACD divergence), technical failure (which would be the resulting RSI breakdown) and a moderately high volume “last price advance” followed by a clear and quick price reversal (the “washout setup”).

To further assist you in understanding this type of setup/reversal, we’ve provided a clear Intraday NQ Washout reversal setup for you to see what it looks like. This is a nearly perfect example of bigger volume and price range at the end of a trend (what we call the exhaustion move) that sets up the new bullish trend. You can see the NQ market had been moving lower and had been consolidating briefly. Just before this washout move, it appears the market was “pausing a bit”. Then, seemingly out of the blue, a big down move generated lots of renewed interest from sellers. Only to have that “exhaustion move”, or what we term the “washout low” to sucker in the sellers, stop out the longs and, eventually, continue much higher.

Could this be setting up this week with an early Monday/Tuesday washout high price rotation in the US markets? Could this be the setup reversal that coordinates with our VIX Spike trigger?
Two items we will be watching early this week are the NQ (tech heavy and usually an early indication of any general market weakness) the XLF (US banking sector). The recent hurricanes and natural event disasters are surely to take a toll on the US consumer for a while. Recent news has suggested that consumer spending is flat in certain areas and that GDP may flatten out a bit. We assume delinquencies will begin to skyrocket based on displaced workers and jobs over the next 6+ months. This leads us to believe a market correction would be a natural, and healthy, event in the immediate near future.
Markets just don’t “go up” perpetually. This recent move higher has been one of the longest in history to not see a 5% or greater correction. Markets need breadth in order to have healthy rotation and we are simply not seeing it recently. This is why we believe any rotation or correction at this time could be bigger than most think. Possibly retesting 2016 lows.

Notice the similarities in all of these charts. It is almost like everything has been running on autopilot in terms of price appreciation within the US majors. We do not have any indication of a sell trigger yet. We would warn investors to be cautious at this time and to protect open long positions. We do believe a price reversal in these US majors will begin before Oct 19th and quite possibly as early as October 4th or 5th. Any moderate price advance early this week followed by immediate price weakness and rotation could be the setup of a much deeper price move.
If you want to continue to receive these types of detailed analysis reports, timely market triggers and analysis as well as Daily market updates, visit www.ActiveTradingPartners.com

The other day, I had an interesting question thrown my way: What’s the single most dangerous investing trend you’re seeing out there right now? What could people be doing that’s a surefire way to just go flat broke?
My answer is probably not what you would expect – after all, today and every day, I’m “Opposite Guy.”
So I’m going to give you the answer you didn’t expect. But it’s the right answer historically.
It’ll help you along your path to becoming a successful, independent, self-directed, and, above all, wealthy investor.
And the best part is, the answer is going to save you a ton of money and heartbreak…
Conventional Wisdom Only Gets You So Far
Here’s something else you probably weren’t expecting from Opposite Guy: You can always follow the conventional wisdom… if you want.
That, however, will only help you in a bull market, when the conventional wisdom is usually right and can stay right for a long time.
Bull markets are when cable talking heads can set themselves up as mystical profit prophets just by hawking the FANG stocks – Facebook Inc. (Nasdaq: FB), Amazon.com Inc. (Nasdaq: AMZN), Netflix Inc. (Nasdaq: NFLX) and Google/Alphabet Inc. (Nasdaq: GOOG) – to the credulous masses.
 See? Bull markets are easy.
But bear markets do come along every so often, and when they do, the conventional wisdom that’s made you bull market gains will lose you a lot of money – fast.
Here’s where I’d bet you were expecting me, Opposite Guy, to say that buying the FANGs is the most dangerous trend.
After all, that’s what all the bears have been saying – and I have a bit of an undeserved reputation as a permabear. I’m supposed to agree that buying the FANGs at these extreme valuations is insane and a surefire way to go broke.
Trouble is, I’m not a permabear. I’m a trend identifier. I use liquidity and technical analysis to signal, identify, and confirm trends, as well as indicate likely turning points. That’s why my analysis has, in fact, been mostly bullish for years. You can follow my liquidity work over at Sure Money and my technical work in the Wall Street Examiner Pro Trader.
Lately, I have been warning that the forces of liquidity that establish market context and drive trends will soon turn bearish, and this week, they started to. My short-term LAMPP indicator, which you can follow at Sure Money, turned red this week.
If you’re not making gains like this… you could be cheating yourself out of tens of thousands of dollars.
That’s a big distinction – and an expensive one if you’ve been following constant doomsayers.
The biggest problem with the permabears is they’ve been saying that the FANGs are about to crash for years. They’ve been very wrong for a very long time.
What’s worse, some of them have been recommending the purchase of puts or outright short sales of these stocks. Those recommendations have been disastrous. If you followed them, you would have been wiped out over and over.
But, like the proverbial busted clock that’s right twice in 24 hours, the permabears will be right one day, and my liquidity analysis suggests that day is probably not far off.
So, for regular investors, the question becomes: Will these stocks crash, or should they be held through thick and thin?
Let’s take a look at one stock in particular – a company chronically hated on (and often disastrously shorted) by permabears – one of the FANGs.
I mean Amazon.com, of course…
Forget the Permabears – Look at the Data
Amazon was one of the high flyers of the dot-com era (turned dot-com bubble).
It started life in 1998 at a split adjusted price of around $1.50/share. It peaked in December 1999 at $113…
BUBBLE!
In 2001, it fell to $5.51 per share…
CRASH!
![]() True, you would not want to have bought it at $113 and ridden it to $6. But let’s be real: A simple trend-following system like the one I’ve developed for Lee Adler’s Sure Money readers would have triggered a sell signal around $68.
True, you would not want to have bought it at $113 and ridden it to $6. But let’s be real: A simple trend-following system like the one I’ve developed for Lee Adler’s Sure Money readers would have triggered a sell signal around $68.
You’d be wounded, but not dead.
Where is AMZN today? $942.
There are those who argue today that Amazon is another crash in the making. The problem is the boy-who-cried-wolf syndrome. Permabears in general, and Amazon bears in particular, have been complaining about the price of the stock ever since it began to recover in late 2001. The company has never earned a profit, they said, for years.
Now they just say that its valuation is insane.
It’s all fact.
But here’s another fact: AMZN is still in an uptrend.
Would I buy the stock up here? No. Hell no – we’re getting very close to the end of this bull market.
But would I sell it? The simplest tools of technical analysis – trend lines, support, and resistance say “not yet.”
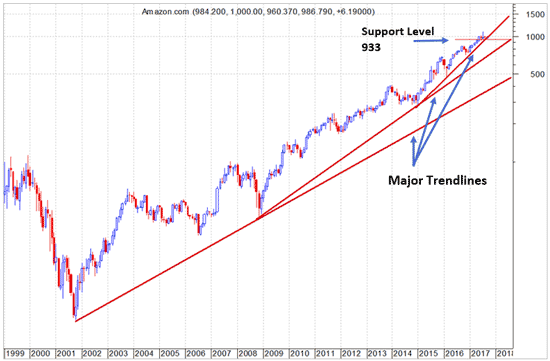
There’s an obvious level on this chart that would make me want to at least start taking some of my money off the table if I owned the stock. That’s $933, the monthly lows of the range of the past three months. In fact, since I drew this chart, AMZN shares have dropped to that level over the past few days. Closing September below that would trigger my first sell signal.
That level also coincides with a two-year trend line. If that breaks, there could be a lot of selling to follow. The next trend line below that projects to around $800 at the end of this year.
So here’s what you should do – and not do…
Don’t Try to Fight the Trend
Is there profit potential on the short side there with Amazon? Not much. There’s perhaps enough for scalpers who are trading the market full time, but not enough for most people. The potential reward over the short run just isn’t worth the risk that the uptrend will resume from here.
I would not even think of shorting AMZN (or any of the other FANGs) on a longer-term basis until the stock has fallen to the second trend line around $800 and then rallied from there.
If the rally failed to exceed the current high around $1080, then I might think about shorting.
But if Amazon shares are doing that poorly, you can be sure that there will be much more interesting opportunities in other stocks.
I would look for stocks that don’t have that cult following to drive constant short-killer rallies, a.k.a. “short squeezes.” Every time a stock like Amazon drops to a major support, professional short sellers will start to cover, and dip buyers will rush in. Violent, short-term spike rallies are usually the result.
The best advice I can give bears who are tempted to short Amazon, or any of the FANGs, is to go take a nap.
It’s a lot easier to nail a 20% decline in a stock that’s in a downtrend and isn’t a cult stock than it would be to nail one in AMZN.
In general, I never short cult stocks. It’s not worth the risk. There are better choices.
Here’s why I just don’t understand serial crash-callers. First, I’ve had a long-time rule that seems obvious to me: Never sell short fad or cult stocks.
Secondly, some “fads” turn into real companies. Amazon is the poster boy for that.
Just because Amazon CEO Jeff Bezos has decided on a predatory model where he eliminates profit, or at least minimizes it, to crush all competition, does not mean that the stock is overvalued. Never short a stock just because you hate its “overvaluation.”
In the same vein, please don’t get me started on the whole concept of “valuation.” It’s a sham. One man’s trash is another man’s treasure. That’s not just true of old furniture. It applies especially to stocks. Valuation is a useless concept in my view. “Cheap” stocks can stay cheap or get cheaper, and “overvalued” stocks can stay “overvalued,” seemingly forever in some cases.
At the very least, don’t short fad stocks or “overvalued” stocks when they’re above support levels or major trend lines. It’s a sure way to lose all your money fast.
Selling short only requires that you put up 50% of the sale price as cash equity. That means that a 25% increase in the price of the stock will wipe you out. You’ll get a margin call well before that, of course. So what! You’ll be forced out with a 50% loss. Someone else will make the decision for you.
Moreover, if you put up the additional required margin, you’re just as likely to lose that. The object of short selling is to make money, not to prove that you’re right. Ultimately, you may well be, but you’ll probably lose all of your money first if you try to short the FANGs.
Always remember: The trend is your friend and don’t fight the Fed! Even with real Fed tightening, now beginning (with the euphemistically named program of balance sheet “normalization”), the market trend hasn’t turned down yet. Respect that. Be patient. Don’t short fad or cult stocks. Don’t buy puts on them. You could still lose it all, regardless of the fact that they are overvalued- or not.
Besides, the time is coming when there will be lower risk opportunities to make money on the short side. Meantime, the safest play is to honor the trend until it’s no longer the trend.
For the U.S. Retirement Market Ponzi Scheme to continue, there must be a new group of suckers to pay for the individuals who are receiving benefits. Without a new flow of funds, the Ponzi Scheme comes crashing down. Such was the case for the individuals who invested in the $65 billion Bernie Madoff Ponzi Scheme that came crashing down in 2008.
Interestingly, the U.S. Securities & Exchange Commission (SEC) that investigated Madoff Securities in 1999, 2000, 2004, 2005, and 2006, found no evidence of fraud or the need for legal action by the commission. The failure of the SEC to find any wrong-doing by Bernie Madoff should provide Americans with plenty of reassurance and confidence that their 401k’s are the highest quality sound investments in the market.
Regardless, the concentration in equities by young Americans reached a record high since the 2008 financial crisis. According to the most recent data put out by the Investment Company Insititute (ICI), Americans in their twenties who participated in 401k plans, 75% of the group invested more than 80% of their funds into equities in 2015 versus 48% of the group in 2007:

In just eight years, Americans in the 20’s age group invested in 401k’s, increased their equity exposure (80+%) from less than a half to three-quarters. Furthermore, those in the 30’s age group increased their equity concentration from 55% to 70% in the same period.
All this means is that younger Americans participating in the 401k Retirement Market have considerably increased their exposure to stocks while net benefits paid out have now gone into the red. I wrote about this in my article, Something Big, Bad and Ugly Is Taking Place In The U.S. Retirement Market:

As we can see in the chart, the Private Defined Contribution (DC) Plans paid out $28.7 billion more than they took in in 2014…. the last year the Investment Company Institute provided data. Simply, Private DC Plans are mostly 401K’s.
Unfortunately, the ICI only has data on 401k net benefit withdrawals up until 2014. However, young Americans invested in the 401k Market have no idea that their funds are being used to pay off those who are retired. Moreover, the record concentration of 20-30’s age group into equities hasn’t been enough to support the 401k Retirement Market as more money is going out than is coming in. That is extremely bad news.
Regrettably, nowhere in the ICI’s new report on the U.S. 401k Market do they include the data showing the net benefit withdrawals in 2014 were more than benefits paid. Instead, they included the following information in the “Key Findings” area at the beginning of the report:

This is an alarming trend. More 4o1k plan participants held equities at the end of 2015 than they did before the financial crisis in 2007. What is even more troubling is the percentage of young Americans who have “ZERO” exposure to equities in the 401k Market.
According to the ICI data, Americans in their 20’s participating in the 401k Market with zero exposure to equities fell from 19% in 2007 to 7% in 2015:

What this chart is telling us is that young American 401k plan participants with no exposure to equities (stocks) before the 2008 financial crisis were much higher than it was in 2015. While the 30’s age group change shown in the chart above change is much less, we can still see that younger Americans are putting more of their 401k funds into stocks than ever before.
This next chart from the ICI report shows the different age groups and their equity concentration in the 401k Market:

While Americans in their 50’s-60’s have decreased their (80+% in BLUE) exposure to equities since 2007, the overall trend, shown as “All” on the right-hand side of the chart, has increased from 43.5% to 47.5%. Furthermore, the 50’s-60’s age group with “zero percentage” exposure to equities (in DARK BLUE at the bottom) has decreased since 2007. Thus, older Americans participating in the 401k Market have increased their exposure to stocks when they should be more conservative.
I look at what is taking place in the U.S. Retirement Market as the final stage of the Greatest Ponzi Scheme in history. Unfortunately, Americans invested in the 401k Market have no idea they are apart of just another Bernie Madoff Ponzi Scheme, but 100 times larger. If the SEC couldn’t find any fraud in the Madoff Securities Investments via ongoing investigations between 1999-2007, what kind of reassurance does that say about protecting Americans in the U.S. Retirement Market?
The Federal Reserve and Wall Street have done an excellent job steering Americans away from sound physical investments like precious metals and into the largest Paper Retirement Market Ponzi Scheme in history. Even though Americans in the 401k Market have increased their exposure to equities, it hasn’t been enough to offset the net deficit as more money is now being paid out than is coming in.
What happens when the stock market finally cracks? Falling stock prices will motivate 401k plan participants to either cut back funds they invest or reduce their equity exposure. Thus, the collapse of the U.S. Retirement Market will be swift as Americans finally get Precious Metals Religion.
Check back for new articles and updates at the SRSrocco Report.
 A brief look over time at periods of extreme volatility in the stock market shows us that many of these periods are associated with unpredictable, large-scale disruptions, often termed as “black swan” events. We have experienced these events within our own lifetime – the 2011 tsunami in Japan, the collapse of Lehman Brothers in 2008, and the unforgettable 9/11 terrorist attacks in 2001.
The origin of the term “black swan” dates back historically to a time when swans were only believed to be only white in colour. At that time, a black-coloured swan was seen as an impossibility. More recently, former Wall Street analyst and Chicago options exchange trader Nassim Nicholas Taleb redefined a black swan event to be an outlier which has an extreme impact but, due to human nature and rationalization, becomes explainable.
A look back over time shows that black swan events occur fairly frequently. They may have a significant short-term impact on the financial markets, but oftentimes do not create any long-lasting impact. These abrupt market-changing events often cause discomfort and, due to human nature, often pressure investors to hastily react. However, in hindsight, after these black swan events are over and things have returned to normal, the simple act of staying-the-course may also be a viable defense.
Are there any pre-emptive measures that you can take to prepare for a black swan event? Here are some practical investment tactics that you might consider to help you to black swan-proof your investment portfolio.
- Diversifying – Having a diversified portfolio may extend beyond ensuring investments across different industries, geographies or asset classes. Consider a strategy that combines various types of risk. Shorter term bonds may be one way to manage interest-rate risk. Inflation-protected investments may help to manage purchasing-power risk.
-
Rebalancing – If one of your shares has gone up so much that its value makes up a greater proportion of your overall portfolio, it may be a good time to consider selling to restore balance. By selling high (and buying low!), the basic idea here is to ensure that proper diversification is maintained through balanced allocations.
-
Hedging – Annuities offer guaranteed income streams and options, such as calls, may help to provide downside price protection to mitigate risk. However, over time hedging a portfolio may be costly and should be managed carefully.
-
Upgrading – More speculative holdings may be replaced with shares of larger, more established companies to form the basis for your portfolio as these companies may have greater stability and be able to better withstand a downturn.
-
Dollar Cost Averaging – By engaging in the practice of buying at regular intervals regardless of market conditions, you purchase greater shares when prices are low and fewer shares when prices are high, lowering the overall cost of shares purchased over time.
Brent Woyat, CIM, CMT
Investment Advisor, Portfolio Manager
Canaccord Genuity Wealth Management
T: 604.699.0869 | F: 604.643.1802
![]()
Canaccord Genuity Wealth Management

-
I know Mike is a very solid investor and respect his opinions very much. So if he says pay attention to this or that - I will.
~ Dale G.
-
I've started managing my own investments so view Michael's site as a one-stop shop from which to get information and perspectives.
~ Dave E.
-
Michael offers easy reading, honest, common sense information that anyone can use in a practical manner.
~ der_al.
-
A sane voice in a scrambled investment world.
~ Ed R.
Inside Edge Pro Contributors

Greg Weldon

Josef Schachter

Tyler Bollhorn

Ryan Irvine

Paul Beattie

Martin Straith

Patrick Ceresna

Mark Leibovit

James Thorne

Victor Adair