
Asset protection
Erik Townsend and Patrick Ceresna welcomes Martin Armstrong to MacroVoices. They discuss Martin’s views on the U.S. Dollar and the future of the European Union. Martin offer his bullish case for U.S. stocks and considerations for international money flows. They discuss future interest rate trends, government debt, the geopolitics of North Korea and Syria and considerations on China and the debt crisis.
N.B. Patrick will be offering two workshops (free to MoneyTalks readers) on How To Trade Options in Calgary and Burnaby on Saturday May 6th and Sunday May 7th respectively. CLICK HERE to register


What happens when new currency is created with few limits by central banks and commercial banks?
Answer: Far too much debt and currency are created.
Central Bank Balance Sheets have increased by $10 trillion in the last decade and $1 trillion YTD in 2017.
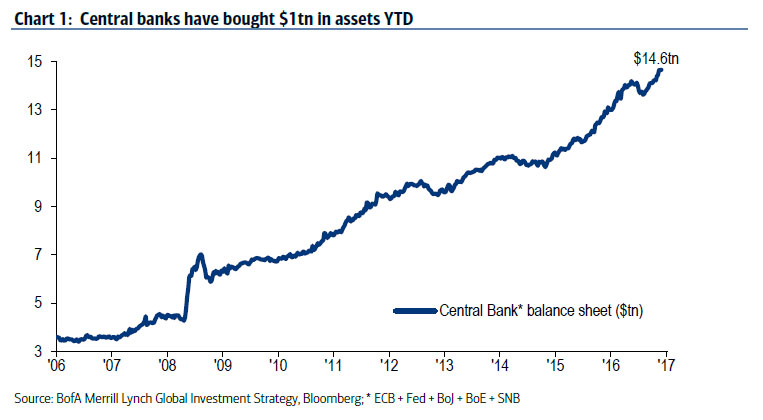
What happens when an extra $10 trillion in central bank debt plus another $80 trillion or so in other global debt is created in a decade?

The debt creation “money hose” levitated the NASDAQ and other stock markets, the bond market, and most commodities. Crude Oil, like gold and silver, rallied much higher and then crashed.
In the U.S. the Dow, S&P, and NASDAQ appear healthy while the economy, employment, and middle class limp along. Many pension funds, after nearly a decade of levitated stock market returns and repressed interest rates, look like a train wreck in the next decade.
Are we close to a blast that will explode our financial world? It hardly matters what the fuse will be, but a few come to mind:
- Escalating war in Syria, Middle-East, and/or North Korea.
- Government shut-down and loss of confidence in the administration and congress.
- Derivative crisis, similar to 2008 meltdown.
- Collapse of the Euro and EU.
- German or Italian banks implode.
- Global dollar crash and rise of the SDR as the new “trading currency.”
- Federal Reserve revival of Quantitative Easing and more aggressive dollar devaluations.
Regardless of which “snowflake” (The James Rickards example) causes the avalanche, there is an avalanche in our future, whether it is an overdue stock market crash, on-going bond market crash, another massive QE program to levitate markets that leads to a crash in the dollar, wars in Syria, North Korea, or wherever the powers-that-be choose for 2017-2018. Read “Neocons Have Trump on His Knees.”
John P. Hussman, Ph.D. Stalling Engines: The Outlook for U.S. Economic Growth
“… we expect S&P 500 annual nominal total returns to average just 0.6% over the coming 12-year period, even if underlying economic growth accelerates to historically normal rates.”
Margin Debt:

Margin debt looks dangerously high, similar to conditions before the 2000 crash and 2008 crash.
Wolf Richter: Stock Markets Sit Blithely on a Powerful Time Bomb
What about the flamboyant NASDAQ? (Log Scale)

The monthly chart shows 25 years of speculation and crash behavior. The NASDAQ looks toppy. Watch out below …

The weekly NASDAQ Composite has accelerated higher – from about 4,600 to 6,000 in ten months. Look out below.

The daily and weekly charts show upward acceleration and increasingly steep support lines. Markets can accelerate higher for only so long before they either correct or crash.
But we are told the Fed and President Trump will make everything great again, the Fed will buy stocks and printdollars as needed to inflate the bubble etc. etc. etc.
Example: “We’re Seeing a Healthy Pause Now, Higher Markets Later This Year.”
Contrary to the Happy Talk from the media:
Sovereign Man: Charles Schwab “announced that the number of new brokerage accounts soared 44% during the first quarter of 2017… the fastest pace in 17 years.” (since the dot-com bust)
Graham Summers: “Stocks Just Triggered a Rare Weekly Sell Signal”
“Paul Tudor Jones Has a Message for Janet Yellen: ‘Be Terrified’”
“…years of low interest rates have bloated stock valuations to a level not seen since 2000, right before the Nasdaq tumbled 75% over two-plus years.”
James Rickards: “Markets Are Set Up for a Fall”
“Once the stock market surveys this landscape of higher rates, slower growth, possible recession and government shutdown, it has nowhere to go but down.”
My opinion: The NASDAQ is primed for a major correction. Other indexes will follow. In response global central banks will print currencies, levitate markets, buy stocks, extend and pretend, and buy time … making the inevitable crash more devastating.
All-time highs in stocks, escalating war news, Italian banks, French politics, Syria, North Korea, Deutsche Bank, blaming Russia, and a dozen other danger zones suggest caution, encourage gold and silver purchases, and create skepticism regarding media “happy-talk.”
Timing a top is difficult given manipulated markets, contrived politics and managed news, but April and May of 2017 look like a time for caution, reduction in stock portfolios, and insurance in the form of gold and silver bullionsafely stored outside the banking system.
regards
Gary

 Abstract
America’s renewed desire to escalate military tensions is a front for America’s continual financial war, this time directed at North Korea, Syria and possibly Iran. This is likely to be the opinion of China’s strategic advisors. We analyse the geopolitics and economics behind America’s war strategy from China’s perspective, concluding that it is entering its final phase. China’s exit plan appears to be to tie the pricing of energy and then other major commodities to gold, returning to the pre-1971 status quo, when the dollar was just a settlement link between commodity prices and gold. Except this time, the dollar itself will be side-lined, so far as China is concerned, which will use the yuan instead for its empire, which will be far larger than that of the US in time, measured by GDP.
Introduction
The day President Trump assumed office, it appeared that at last there would be détente with Russia, leading to America’s withdrawal from unwinnable conflicts and towards a new peaceful agreement between these long-term enemies. However, within the traditional presidential bedding-down period of one hundred days, Trump has gone from his electoral platform of disengagement from foreign ventures to overt aggression in multiple locations.
Something major has changed his thinking. Trump has committed no less than five acts of foreign aggression in that short time, with a sixth pending….
….continue reading HERE (be sure to read the conclusion!)

From Tulips to South Seas, from Dot Coms to Houses, all manias have something in common. Assets rise gently, largely unnoticed by the great unwashed, as the easy money is made and price rises above historical norms they become more popular by mainstream, then they become overvalued as their price rises way above “intrinsic value” and when the mania finally matures overvalued grows to extremely overvalued. And then at some point in time at some price level on the chart the market exhausts itself and collapses back to and often below it’s starting point. These collapses tend to be sudden, out of the blue and violent and usually happen without any obvious cause or reason. What was made during the boom gets lost in the bust. Only the smart money has greater odds of surviving ending manias but only if it does not get outsmarted.
 What we as Danielcode members are interested in is markets turns. As we said above manias end at some point in time and at some price. Think about that for a minute. A mania pushes up price to a certain level and at one specific point on the chart it all collapses under its own weight for no obvious reason. Whatever reason is pinpointed to the start of the crash by financial journalists is merely linking an event or piece of news that happened after the top was made. The real question on our mind is “Why is a specific price THE top and why did that top happen in that specific week or even on that specific day?” And God help us, what if we could foresee these points on the chart and have a good idea where and when they should happen. Is that even possible? The truth is that God does help us, the sad truth is that no one listens and even less are interested.
The Danielcode is a mathematical matrix of numbers straight from the book of Daniel discovered by our mentor John Needham. How these numbers are calculated is beyond my time schedule to write here but you can discover all of that in the “Live at the Springs” audio under the articles tabs at the Danielcode website. The Danielcode ratios are 29.7 , 37.5 , 44.5 , 50 , 62.5 , 59.3 , 74.2 and the powerful 89 number. And these numbers are important folks. Very important. They rule all markets in both time and price, they even rule all life and death in the universe. Or do you think it is a coincidence that the synodial month, the average length of a month, is 29.7 days or that the orbit of Saturn (referred to by the ancients as Cronus or Kronos the Roman Deity of Time) is 29.7 earth years or that the orbital velocity of Mercury is 29.7 miles per second?
Maybe. But our mentor has shown us so many charts where price has recognized so many Danielcode numbers always with precision down to a few ticks that I have completely sworn off Random Walk theory a long time ago. Nothing is random in a chart my friends. Markets are not random, they are perfectly mathematically organized, and sometimes even perfectly predictable. Let me show you what I mean.

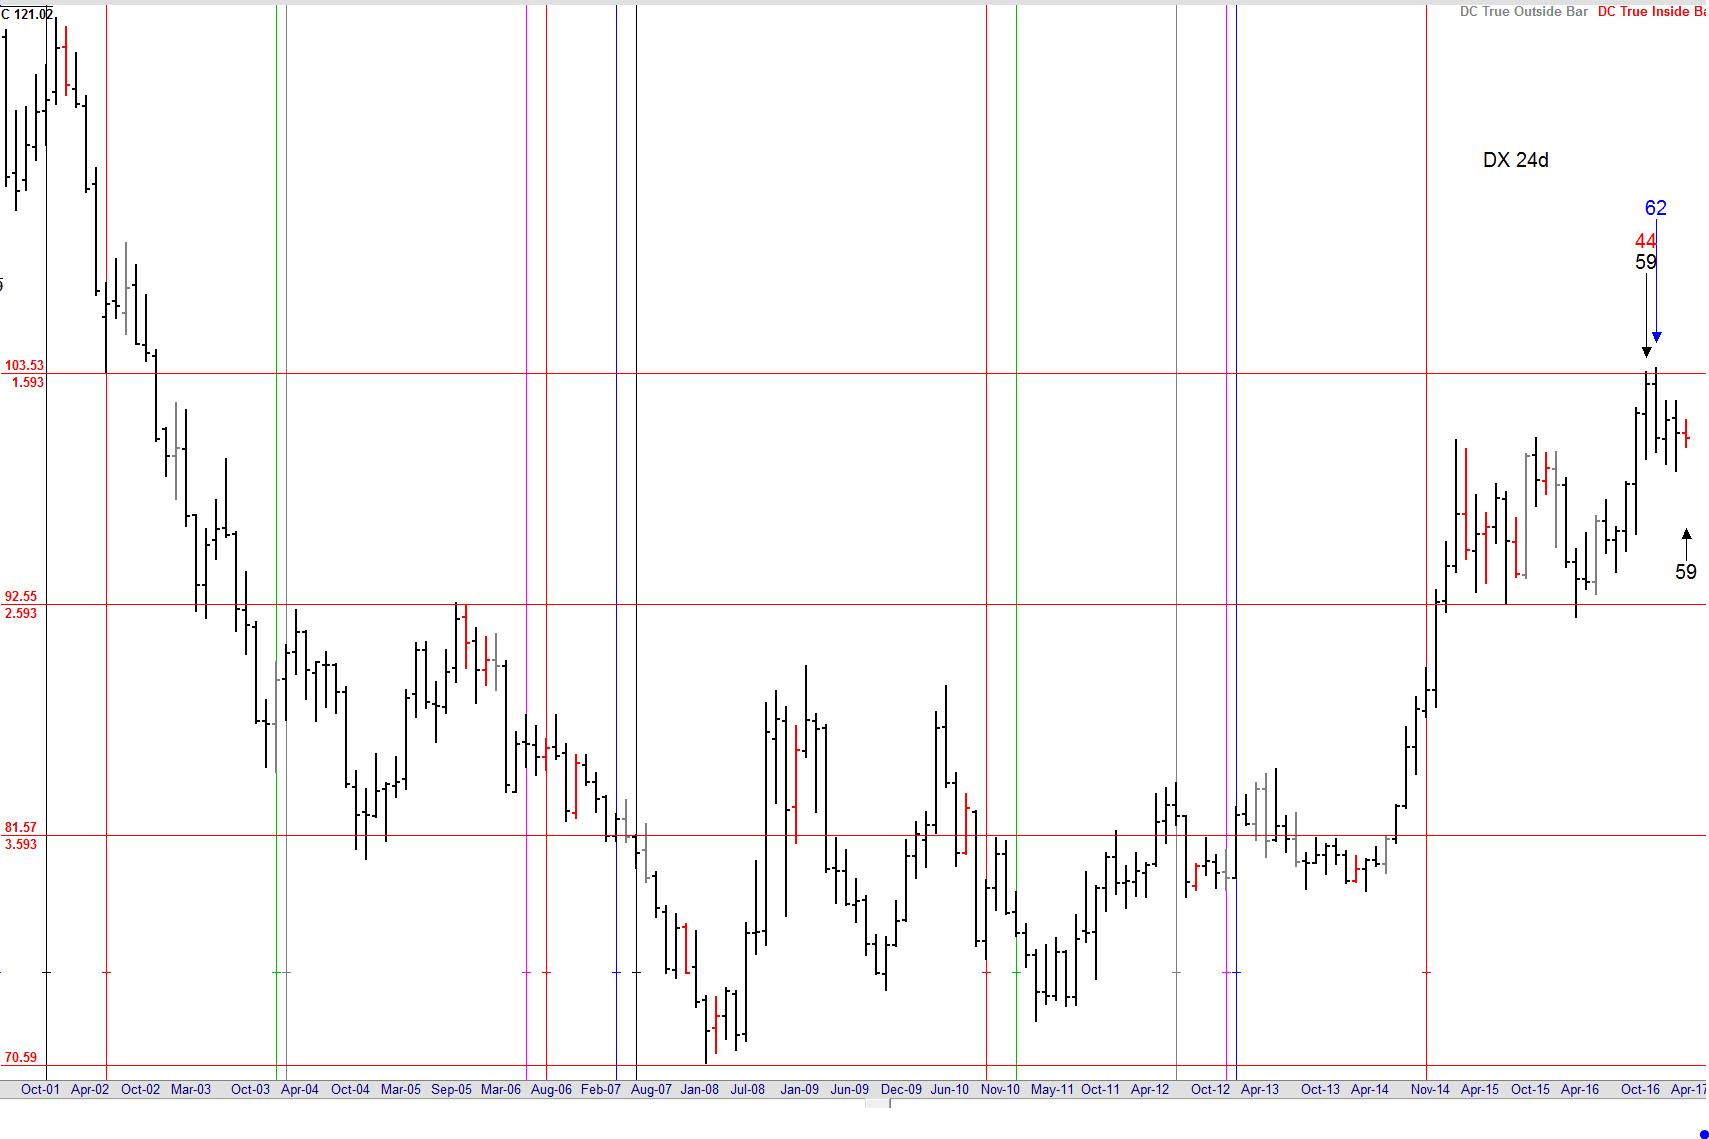
This is a 24 day chart of the US Dollar Index DX. Non-daily Danielcode charts are always composed of bars that contain 6 trading days or multiples of that (12, 24 and 48 trading days). The reason for that is beyond the scope of this article but it all comes straight from the Bible. You can read about it in the two “Master Class” articles on the Danielcode website under the articles tab. (Master Class I and II). Notice how the strong rally in DX since 2014 found it’s perfect top at 100.51 just 3 ticks shy of the 59.3% retracement from the 2008 low to the 2001 high. And how this happened on a 59 time cycle. Yes, that’s right, these numbers can also be projected on the time axis of the chart where they become time cycles instead of price levels.
If you think this is complex, let me tell you that I had never seen a trading chart before I met the Needham family in Taupo, New Zealand for a Danielcode Tutorial a few years ago. That was the first time that Mr Needham had taught The 4th Seal, and since then I have loved, lived and worked with it every day. It is indeed a marvel.
Now take a look at the next long term DX chart and how this market reacts to known Danielcode numbers in the form of price extensions. Does this seem random?
I don’t think so. The precision with which the price levels from the Danielcode sequence are recognized is stunning. Markets recognize these numbers all the time and if you draw the right DC sequence that a market is following on your chart you will see that markets lock on to these sequences for months sometimes even years in a row before switching to another DC sequence. It’s truly amazing how precisely all markets vibrate on the Danielcode sequence. And it happens all the time right before your eyes and totally unnoticed by even the biggest and smartest traders on the planet.
The current state of the market
A question many financial experts are asking themselves is: “What’s next?”. In fact it is the most important question on every mind that cares about the market. The truth is, we don’t know. Nobody does. Only our Creator has foreknowledge. But there are clues and chance favors the prepared mind. Allow me to help prepare your mind.
Here at the Danielcode we try to become experts at timing market turns and we approach this from a totally different angle. We use the numbers from the Danielcode straight from the Book of Daniel in the Bible. Sounds scary right? It’s not. In fact it’s quite a miracle.
Below is a 24 day chart of the NASDAQ NDX. It has a DC regression channel drawn on it that is constructed on the important 59.3 DC ratio.
This chart shows The Death Cycle on NASDAQ. The last Death Cycle we saw was on the S&P in October 2007 and you know how that turned out!!
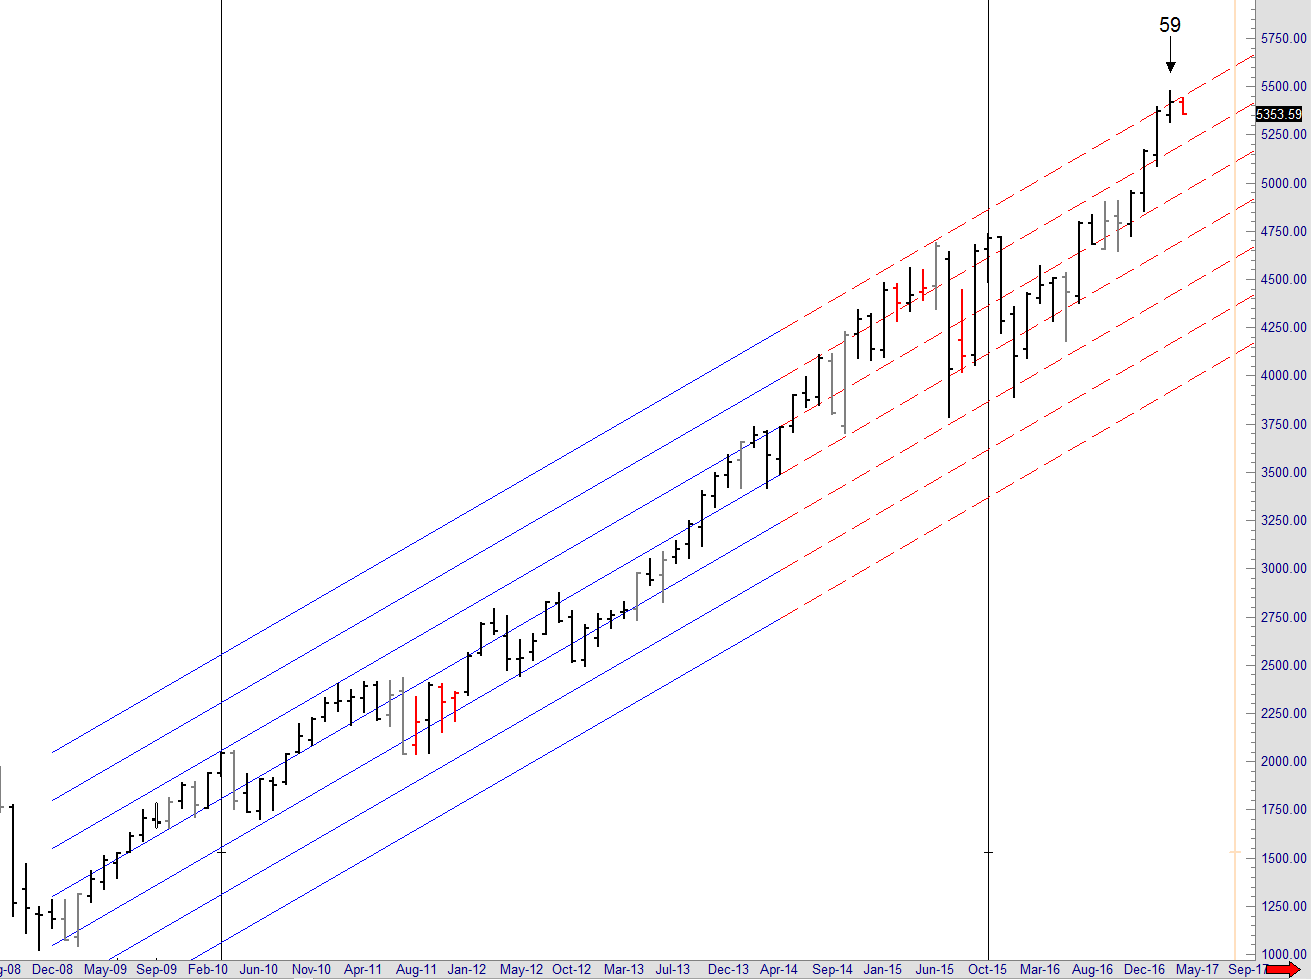
Notice how this market is at the 3rd standard deviation of the DC regression channel. This means that this market is 3 standard deviations away from the median of its uptrend. This in and of itself is a sign of extreme speculation and tells us NDX is on a unsustainable path. Markets rarely go beyond the 3rd standard deviation. But there is more. Both the 24 day chart and the 6 day chart have a 59 death cycle expiring early April. Death cycles are 59 topping cycles expiring from the first hub. When they bite they kill the market and turn its trend around to clear whatever excess was build up during the boom. On the 6 day chart of NDX we already broke the low of the previous bar which means this 59 death cycle is alive and kicking. Once the 24 day chart does the same odds are that this market has a serious meeting with mother nature’s laws of gravity and that my friends should get you on high alert for the potential end of this bull market and the start of a financial storm. When the Danielcode 59 death cycle bites there is no interest rate or central bank liquidity injection that can save the market. Markets turn on Danielcode ratios of time and price and when they do, nothing or nobody can change that. Markets do not turn because they are overbought or because some event happens. They turn on a specific time and price because it’s in their DNA to turn there and that DNA is ruled by the Danielcode numbers hidden in the old testament. Amazed? You should be.
The 3rd Day
Remember I just showed you how NDX was at the 3rd standard deviation of the mean? 3 is a fractal of 6 and 6 days is a DC week (“6 days you shall work and on the 7th day you shall rest”). The number 3 is important all across the Bible and since it’s Easter today let me remind you what is written in Luke 24:7
Luke 24: 7 “The Son of Man must be delivered over to the hands of sinners, be crucified and on the third day be raised again.”
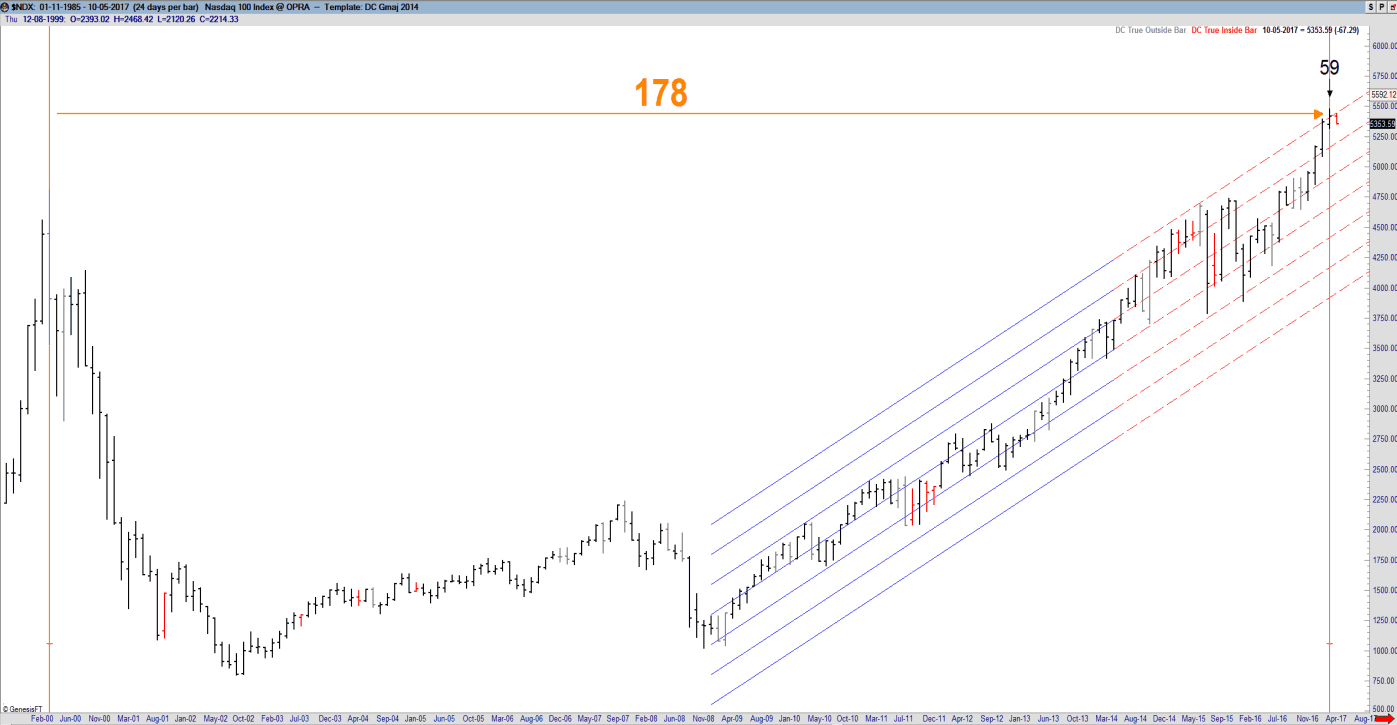
Well folks, take a look at the next long term 24 day chart of NDX. The 59 time cycle comes from the 59.3 Danielcode number and that number comes from 1335/45 which is 29.666 half of 59.333. If you multiply that number by 3 you get exactly 178. Well in early April we were 178 bars away from the 2000 peak in NDX.
And that my friends should get you exited. The Danielcode is the biggest discovery in financial markets ever made. I know that is a big statement but I also know it’s true. I do not wish to impress you nor do I care whether you believe me or not. But I know that you cannot deny the charts I just showed you and I hope that is enough information to get your investigative mind stimulated so you can do some digging around on the Danielcode website yourself. There is a ton of information there just waiting to be discovered and I promise you that the believer’s mind will be blown away. And remember, markets are ruled by the Danielcode. They always have been, they always will be. Even Isaac Newton knew that there was major knowledge hidden in the book of Daniel.

There still seems to be some doubt in many investors minds on how much gold there is in the world. I continue to receive emails from individuals who read articles stating that the amount of gold in the world is much greater than the official estimate. Recently, I have received a spike of emails questioning the amount of gold in the world due to all these supposed “SECRET GOLD STASHES.”
Due to this, I decided to write an article to set the record straight… once and for all. I actually wrote about this in a previous article early last year. However, new information as well as additional data should help provide more FACTS vs the LOUSY CONSPIRACIES.
Before I provide this information, I would like to say the following… I mean no ill will or disrespect for analysts that I disagree with. That being said, I find it quite frustrating when individuals are being misled due to faulty or incorrect information put out by these analysts. Some analysts even state their “Conspiracy Theories” are not conspiracies, but rather…. FACTS. This is even more erroneous than providing a faulty conspiracy.
For example, some precious metals analysts suggest the Fed and Central Banks can push the price of gold anywhere they see fit. This is totally false. There is some method to their madness. This chart, republished from a previous article, shows the gold market price versus the cost of production from the top two gold miners (Barrick & Newmont) 2000-2012:
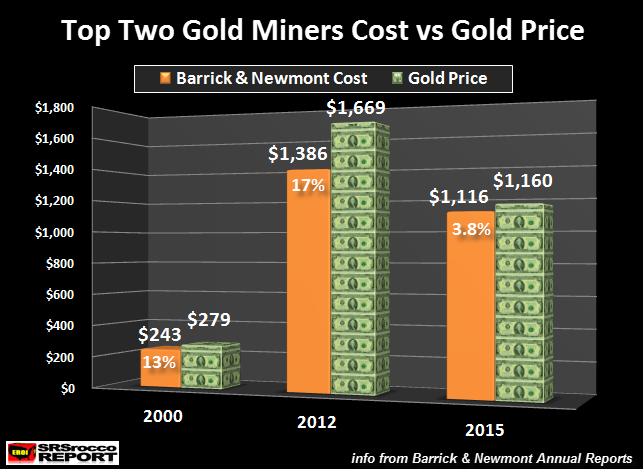
From 2000 to 2012, the total production cost for these top two gold miners increased from $243 an ounce to $1,386. Thus, their cost of production in 2012 jumped 5.7 times higher than it was in 2000. Interestingly, the gold market price increased 6 times from $279 in 2000 to $1,669 in 2012. Thus, the overwhelming increase in the market price of gold was a result due to a much higher gold production cost.
Moreover, we can see that the production cost of gold was $1,116 in 2015 versus a market price of $1,160. Which means, the gold market price in 2015 was approximately 4% higher than the cost of production from these two top miners. The Fed and Central Banks cannot push the price of gold down too far below its cost of production, or SAVVY TRADERS will come in with both hands and buy up as much as they could. Smart traders understand this cost of production-market price relationship.
Okay, let’s get back to the notion of all this SECRET GOLD being hid in the world. A few years ago, Antal Fekete and Karen Hurdes did an interview where Karen spoke about acquiring all this hidden gold in Hawaii and using it to back the U.S. Dollar. I have a great deal of respect for Antal Fekete, but for him to be sitting next to Karen as she spoke about this… makes me wonder how much he regretted it later on.
Regardless, for being a very bright individual, Karen Hudes is guilty of not fact checking her assumption that there is 170,000 metric tons (mt) of gold hidden to be used to back the Dollar. I came across an excellent article titled, Karen Hudes & Wolfgang Struck Using Myths To Muddle Global Financial Reset:
There are multiple parties that have been using the fabled Marcos Gold, Yamashita Treasures, and bogus Maharlika land titles for extracting “membership and processing fees” from unwitting victims.
As of late, personalities like Karen Hudes and Wolfgang Struck, both claiming to have worked in the World Bank, and UBS, respectively are advertising their collective efforts to cause a global reset through the “Global Debt Facility”.
The problem with what these two self-confessed experts on global finance is that they are supporting their claims with spurious historical data, some even strayed too far from alternative accounts now beginning to surface here in the Philippines.
There’s a lot of good reading there as well as documented proof that many of the claims made by Karen Hudes are completely unfounded. I don’t want to waste too much time on the specifics as the article does an excellent job. Those with doubts, please take the time to read that article.
Then we have the work of Bix Weir at Road To Roota. While I agree with Bix that the value of gold and silver will rise in the future, we are world’s apart on the LOGIC and FACTS. Bix provides his thoughts on the amount of gold in the world in his section of his site called, GOLDEN SECRETS:
Fair Warning! What follows may scare the Dickens out of you gold bugs but will make silver bugs fall over themselves to swap even more of their gold for silver. Refresh yourself on the benefits of swapping gold for silver here: http://www.roadtoroota.com/public/136.cfm
The mainstream gold world wants you to believe that in the entire history of gold mining there has been just over 180,000 tons of gold mined from the ground. On top of that, with all our latest seismic and exploration technology, we have only found about 100,000 tons of underground gold reserves that could be economically mined in the future. That is what “they” want you to believe but…
THIS IS A BOLD FACED LIE!
Don’t get me wrong…I’m a gigantic gold buff but we need to understand the truth to ever reach a point where gold can take it’s rightful place in our corrupt monetary system….
WHAT THE PUBLIC KNOWS
There are two widely accepted gold statisticians that are followed religiously by the gold mining companies, central banks, governments and investment community:
Above Ground Gold: GFMS, Ltd. is the above ground gold market prognosticator and claims that the total amount of gold ever mined in the world is 180,000 tons (5.8B oz). Historically, this measure rises only as gold is pulled from the ground as reported by global gold mining companies around the world. Any “mystery gold” that suddenly appears on the market in ETF’s, on the LBMA, in the COMEX warehouses or in Government coffers is assumed to come from the unreported gold held by private individuals so that their historical figures never have to change.
In many of Bix’s interviews, he states that the above-ground gold figure was originally stated by Harry Oppenheimer in the 1960’s. What Bix is suggesting here is that the gold market and mining industry is just taking one individual’s analysis for the basis of all the gold mined to date. This is akin to providing ONE SOURCE when a student is writing his PhD dissertation. If a student did that, the teacher would look at him straight in the face and say, “ARE YOU INSANE or STUPID??”
Unfortunately, some analysts do not do enough fact checking. While they may provide additional supposed sources, they do so from the same area. However, to provide accurate analysis, you must provide data and sources from many different areas. That is what I try to do to make sense of it all.
For example, the 2017 GFMS Gold Survey stated that total historical gold mine production is estimated to be 187,500 mt, with a current value of $7.7 trillion. I can assure you, GFMS did not pull that figure out of thin air, or take the word of one Harry Oppenheimer, more than 50 years ago. Rather, the historical data on global gold mine production has been done by several sources over 100 years ago.
Here is a table from the U.S. Bureau of Mines Summarized Data On Gold Production, published in 1929:

In the U.S. Bureau of Mines report, there were plenty of older sources quoted. Here are a few:
 https://dj0s31cxqi9ot.cloudfront.net/wp-content/uploads/2017/04/US-Bureau-Of-Mines-1929-Sources-60×35.png?x65756 60w”>
I would also imagine these sources above would likely quote even older sources. So, as we can see here, there is AMPLE FACTUAL data going back 150 years (or more) that provides reasonable estimates of historic world gold production. While the estimates are not EXACT figures, they can be relied upon as a good approximation.
I took the data from the U.S. Bureau of Mines 1929 report as well as more current data from the USGS – U.S. Geological Survey and GFMS to create the chart below of world gold production to date:
 https://dj0s31cxqi9ot.cloudfront.net/wp-content/uploads/2017/04/World-Gold-Production-1493-2016-60×43.png?x65756 60w”>
My figure of 173,000 mt only uses data from 1493-2016 and may be a bit different due to using USGS figures for certain years rather than GFMS data. So, if we include gold produced prior to 1493, my 173,000 mt figure is quite close to GFMS estimate of 187,500 mt.
Now, the reason world gold production surged in the 1900’s was due to the advent of oil. A barrel of oil equates to thousands of energy slaves. Thus, as global oil production increased exponentially after 1900, so did gold production. Matter-a-fact, 91% of all gold produced since 1493 came since 1900 and 70% of all that gold was produced since 1950.
Which brings us to this LOGICAL conclusion…. How can there be 1-2 million tons of gold in the world hidden in these supposed underground vaults if the world was only able to produce less than 200,000 mt???
Some people believe the ancient peoples, such as the ancient Roman Empire, produced a lot more gold than we give them credit. Well, I have looked at some research that provided good estimations of ancient Roman gold production. I provided this information in my previous gold article:
Estimated Ancient Roman Gold Production
According to information from the ancient book, Naturalis Historia by Pliny the Elder who died in 79 AD,annual gold production in the Roman Empire was estimated to be 9 metric tons per year (Production in Asturia, Callaecia, and Lusitania (all Iberian Peninsula) alone – Wikipedia)
That 9 metric ton figure is not for the entire Empire, so lets attribute 15 mt per year. If we assume the Ancient Romans produced 15 mt of gold for 500 years, that would equal 7,500 mt. I doubt they produced that much, but if they did.. it still won’t change the total 170,000 mt figure all that much.
Regardless, most of the ancient gold produced may be lost forever. Which is why GFMS states that 170,000 mt is a good ball park figure. Now, could they have missed some… sure. So, let’s add another 30,000 mt to get a total of 200,000 mt. That is still ten times less than the 2 million ton figure that Bix Weir and Karen Hudes claim.
Folks, it is just physically impossible for ancient peoples to produce the amount of gold that can be extracted by massive haul trucks that can move 400 mt of ore in a single trip. These trucks average about 0.3 MPG. I spoke with someone who worked at a large open-pit mine and he told me that these huge haul trucks go through five sets of tires a year. Some of these tires are 13 feet high and cost $50,000+ a piece.
In addition, gold production wasn’t the only metal that increased exponentially with oil…. so did copper and silver (just to name a few):
 https://dj0s31cxqi9ot.cloudfront.net/wp-content/uploads/2017/04/Global-Copper-Silver-Gold-Production-Since-1900-768×520.png?x65756 768w, https://dj0s31cxqi9ot.cloudfront.net/wp-content/uploads/2017/04/Global-Copper-Silver-Gold-Production-Since-1900-60×41.png?x65756 60w”>
Here we can see that all three metals (copper, silver and gold) increased exponentially along with oil. Thus, if we assume the majority of most metals increased the most since 1900, especially since 1950, the majority of production of these metals have come more recently. Using logic, we can plainly see that the official estimate of 187,500 mt of gold produced in the world is likely a very realistic figure.
Now, the reason I bring this up again is to try to inform individuals who have been mislead by LOUSY CONSPIRACY THEORIES, that while conspiracies do take place and are real, not everything is a conspiracy theory.
Bix Weir also mentions there is all this gold hidden in the Grand Canyon due to some 1909 article on the Arizona Gazette. I suggest you all take a look at this article, Canyonitis: Seeing evidence of ancient Egypt in the Grand Canyon:
The original story goes that the team found an underground network of tunnels, high above the Colorado River, containing various ancient artefacts, statues and even mummies. A major discovery, no doubt about it. Impossible to slip off the archaeological radar. Still, the Smithsonian Institute will report it has no records on the subject. So what happened? To find out, there is only one guide: the article itself. Though the article was anonymous, it did identify some of the archaeologists involved: “under the direction of Prof. S. A. Jordan”, with Smithsonian-backed adventurer G. E. Kinkaid, who then relates his findings.
But the story gets weirder when the Smithsonian stated that it had no Kinkaid or Jordan on record. In one enquiry from 2000, the institution replied: “The Smithsonian Institution has received many questions about an article in the April 5, 1909 Phoenix Gazette about G. E. Kincaid and his discovery of a ‘great underground citadel’ in the Grand Canyon, hewn by an ancient race ‘of oriental origin, possibly from Egypt.’ […] The Smithsonian’s Department of Anthropology, has searched its files without finding any mention of a Professor Jordan, Kincaid, or a lost Egyptian civilization in Arizona. Nevertheless, the story continues to be repeated in books and articles.”
The article goes on to say that the truth is somewhere in between CONSPIRACY and FACT based on hidden Egyptian treasures… not a huge gold reserve. That being said, there are these folks called “INDEPENDENT GEOLOGISTS.” They can look at mineral and oil deposits and aren’t being paid by the corporations and the Elite to keep the supposed truth from Americans that there is all this HIDDEN GOLD and CAPPED OIL WELLS.
I still come across people who tell me that the United States has all these uncapped oil wells and when we want, we can just open up the spigot and let the oil flow. I can tell you from talking to several oil geologists that NO ONE ever wants to shut in an oil well… only if there are problems with the well. Why? Because once a well is shut in, when it is opened later on, its production never returns to what it was before. Shutting in an oil well normally destroys the productivity of the well in the future. Again… the oil industry does not want to SHUT IN AN OIL WELL… only if it has to, and not because of waiting for higher prices in the future.
Furthermore, I have also spoken to some gold geologists, and they tell me that if there was all this hidden gold in the United States, we would have gone after it already. Because, the economic model of resource extraction is that we go after the BEST FIRST, then mine the lower quality ore as time goes by.
Analysts who continue to talk about the hidden stashes of Hawaiian Gold, Yamashita’s Gold, the Nazi Gold and so on and so forth do so because people who don’t fact check are completely gullible. Moreover, those analysts who focus on what I call, LOUSY CONSPIRACIES can make money peddling this to their unsuspecting subscribers.
Folks… LOUSY CONSPIRACIES can be financially rewarding for analysts as it is addictive to their readers. And to keep the money flowing using this business model, more and more LOUSY CONSPIRACIES have to be promulgated. It is a sad and viscous cycle.
I hope this clears up the notion of 1-2 million tons of gold floating around in the world. Those who continue to believe it after they have read this article… you have my sympathies. Why? Because the Falling EROI – Energy Returned On Investment, not even known by those who peddle lousy conspiracy theories will push our modern society over the edge to collapse… a collapse we can never grow back out from.
Lastly, those analysts who promote a story that when the markets crash and the financial institutions are finally allowed to go bankrupt, that we can rebuild… are doing serious harm by misleading individuals. When the collapse comes, we won’t be able to grow out of this one. Rather, we transition to something more regional and local… at best.
Check back for new articles and updates at the SRSrocco Report.

-
I know Mike is a very solid investor and respect his opinions very much. So if he says pay attention to this or that - I will.
~ Dale G.
-
I've started managing my own investments so view Michael's site as a one-stop shop from which to get information and perspectives.
~ Dave E.
-
Michael offers easy reading, honest, common sense information that anyone can use in a practical manner.
~ der_al.
-
A sane voice in a scrambled investment world.
~ Ed R.
Inside Edge Pro Contributors

Greg Weldon

Josef Schachter

Tyler Bollhorn

Ryan Irvine

Paul Beattie

Martin Straith

Patrick Ceresna

Mark Leibovit

James Thorne

Victor Adair