
Asset protection
 The Nasdaq Composite Index also climbed to a record, with materials producers leading gains as copper and aluminum advanced. Housing stocks surged after the largest U.S. builder delivered earnings, while engineering firms gained as President Donald Trump took steps to advance construction of oil pipelines. Banks jumped as the yield on the 10-year Treasury note climbed back above 2.45 percent. Crude topped $53 a barrel.
While politics continued to sway financial markets as a U.K. court ruled parliament must vote on any Brexit plan. Donald Trump sought to cajole U.S. automakers to build plants in America and vowed to renegotiate the Keystone XL and Dakota Access pipelines. Investors also turned to a slate of corporate earnings that began to show signs that the economy was on firm footing at the end of 2016. D.R. Horton Inc.’s results come amid data showing rising home construction and a pickup in demand as mortgage rates start to climb. The first reading on last quarter’s U.S. economic output is due Friday.
Investors replaced Monday’s cautious tone with a risk-on attitude. Why not? It was ‘Turnaround Tuesday’! The change of heart was most obvious in the Treasury market, which lost all of Monday’s gain as the 10-yr yield swung seven basis points higher to 2.47% after losing the same amount the day before. The U.S. dollar faced a similar dynamic, with the U.S. Dollar Index (100.34, +0.39) adding 0.4% after succumbing to selling pressure on Monday.
Generally speaking, investors traded Treasuries for stocks, but they were more specifically after growth-sensitive equities as all six cyclical sectors outpaced the broader market. Materials led all sectors with a 2.5% gain, setting the pace early following DuPont’s (DD 76.05, +3.27) positive earnings report. The stock jumped 4.5% after the company beat earnings estimates and announced that its merger with Dow Chemical (DOW 59.64, +2.50) is expected to close in the first half of 2017.
A ways off from the materials sector was the financial space (+1.2%). The sector ended in second place after many of its top components recouped some of the losses suffered at the start of the earnings season. Technology, the only sector with more influence than financials, finished the day 1.0% higher after strength in chipmakers sent the PHLX Semiconductor Index higher by 2.0%. In the broader tech space, Yahoo! (YHOO 43.90, +1.50) was the most notable advancer after reporting favorable earnings results following yesterday’s close.
Economic data was limited to December Existing Home Sales:
Existing home sales for December decreased 2.8% from November to an annualized rate of 5.49 million units while the Briefing.com consensus expected a reading of 5.55 million. The key takeaway from the report is that inventory constraints, rising prices, and higher mortgage rates remain a key obstacle to stronger sales activity.
I am still in the camp that probabilities still favor a seasonal (cyclical) pullback between now and mid-February, but we’re not short (having covered our inverse ETFs on Monday) and awaiting renewed bearish technical signals. With the SPX and Nasdaq into new highs and most other indexes with the exception of the Russell 2000 on the verge of breaking out, patience is the key. That said, followers of my VR Cannabis/Vice, VR Gold Letter and VR Platinum portfolios know we’re remain committed to recommended positions.
…also from Martin Armstrong:

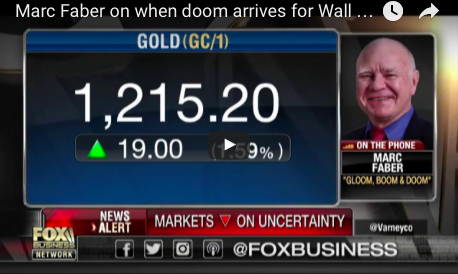
“There is a lot of liquidity in the world and I believe that whatever you think, the liquidity will move into precious metals in the next three to six months,” he said. Faber recommends investors look to add precious metals to their portfolios, telling Varney, “I would be long gold shares, silver shares, platinum.”
….also from Faber: There is an Excess of Liquidity in The Markets

Last week I told you about gold’s long-term prospects: $5,000 at least.
And if you’ve been following my shorter-term forecasts for gold, then you know that they’ve been spot on. I’ve been calling for an extended short-term cycle low — which we got on December 15 at $1,124.30 in the February 2017 futures contract — and then a rally.
That rally is now underway, and this past Friday gold hit as high as $1,207.20.
Here was my previous AI Neural Net forecast for gold, then I’ll show you an update:

You can see the rally through January 12 on this chart. You can also see how the rally should stair-step higher in mid-April before a mild pullback sets in.
How high can gold go by then? Not a whole lot higher. Maybe $1,350 to $1,400.
Now, here’s my latest AI chart for gold: The shape is changing a bit, as it should be, but the overall forecast remains the same: A rally in April before pulling back. Note that this chart is a tad behind the action, since my live forecasts and AI charts are reserved for members of my paying services.

So what’s causing the rally? In gold, and other precious metals? Pick your flavor …
I won’t cover them in detail here, again, that’s for members. But look around the world …
![]() Still nasty politics in the U.S.
Still nasty politics in the U.S.
![]() The rising tide of my war cycles, which I have warned you about repeatedly, even telling you they were due for another accelerated rise right now. And look, we have …
The rising tide of my war cycles, which I have warned you about repeatedly, even telling you they were due for another accelerated rise right now. And look, we have …
![]() Trump/Putin still wrangling.
Trump/Putin still wrangling.
![]() 4,000 American troops just sent to Poland, the biggest buildup in Eastern Europe since the Cold War.
4,000 American troops just sent to Poland, the biggest buildup in Eastern Europe since the Cold War.
![]() Syria, Aleppo, Mosul and more.
Syria, Aleppo, Mosul and more.
![]() High tensions between the U.S. and China over the “One-China policy” and Taiwan. And the South China Sea.
High tensions between the U.S. and China over the “One-China policy” and Taiwan. And the South China Sea.
![]() The horrendous humanitarian/refugee crisis in Europe, where men, women and children are dying.
The horrendous humanitarian/refugee crisis in Europe, where men, women and children are dying.
![]() And more.
And more.
Is it any surprise there are plenty of fundamentals building to drive precious metals higher? Have they bottomed? It’s too soon to say but I like the action.
What about other markets, for instance equities, the Dow Industrials? The Dow is getting ready to roll over.
You can see it right here, on my latest AI chart for the Dow. It should be rolling over and should head lower into late March before bottoming.

Just a pullback. No crashes. Support at 17,500 to 18,500.
That may seem like a steep decline, even to 18,500, and it is worth getting out if you are heavily invested, or hedging with an inverse ETF.
But it’s not the disaster many are calling for. Once it bottoms, the capital flight into the U.S. will resume in spades and the Dow will be off to 25,000, then even higher, to at least 32,000.
Stay tuned, very tuned in to my writings and analysis of the gold market. In fact, of all major markets. Plus, as I noted last week, be sure to read my E-wave columns each Monday, Wednesday and Friday afternoon published around 4 p.m. EST. They are short, but very inciteful.
Best wishes,
Larry
It’s so important that you get your free copy of “STOCK MARKET TSUNAMI” right away, click here to download now!
…related from Frank Holmes with 5 charts:
The bullish case for gold in 2017


Collecting is instinctive within humanity. Everyone has formed a collection of something, no matter how small. From childhood, we all have accumulated objects in different categories, be it matchbox cars to collections of Barbie dolls. Their questionable usefulness is only second to the fascination of playing with them. The first coins used in China were cowrie shells. They were beautiful and rare since they could not be found everywhere. The first attempt to expand the money supply, and make bronze appealing and acceptable, involved making the money into the image of a cowrie shell.
I got the bug when I bought my first Roman coin for probably $5 when I was 10 to 12. I would recommend ancient coins, for their market is global. Canadian coins are salable in Canada just as the best market for the U.S. coins is in the United States. Yet, ancient coins cross all borders. The Chinese and Russians are big buyers these days. Cars are too hard to store. Fine art is also something I have collected over the years. I can more than quadruple my investment in things like Rembrandt etchings (the one pictured is of his father).
I have collections of rare books and autographs as well. There are collectors for every category of object. There was the Villa of the Papyri, a private house in the ancient Roman city of Herculaneum, who collected art and books. This tremendous collection has fascinated visitors beyond belief.

I find it to be mind-blowing when financial advisors and stock market gurus get in bubblevision or write Seeking Alpha articles and assert that the stock market is good “relative” value right now. They are either dishonest, unethical or just stupid. Likely a combination of all three in varying degrees.
Here’s a chart with which everyone is familiar:
Based on that graphic, it looks like the current stock market is only the third most overvalued in history, right? WRONG.
The problem comparing the current p/e ratio of the S&P 500 with that of previous stock bubble tops is that the accounting used to produce the “e” is not comparable. Over time, FASB and the SEC have colluded to make it easier for companies to hide losses and report non-cash income as GAAP cash flow and earnings..
As an example, in 2010 FASB issued a bulletin which changed the way big Wall Street banks were allowed to account for bonds and other forms of debt issued by others that are held as assets. Originally, banks had to market their bond/debt/loan holdings to market and accrue any market to market gains or losses at quarter-end as either income or expense. FASB decided to let banks classify any and all debt as “hold-to-maturity,” and allowed banks to hold this debt at face (maturity) value without ever marking to market. Any debt that was marked below maturity value (par value) could be marked up to par and moved into a “held to maturity” account. By doing this, the banks created non-cash gains in these holdings that was counted as income. Banks hold $100’s of billions in bonds/loans and, starting in 2011, this rule change allowed banks to create billions in phantom, non-cash income. This of course translates into lower p/e ratios.
There’s several areas of accounting over the years that have accomplished a similar feat for all publicly traded companies. The problem is that it has rendered p/e ratios over timeincomparable. Of course, NO ONE points out this fact and certainly any Wall Street analyst would be fired if they went on a truth tirade. The bottom line is that, looking at the p/e ratio graph above, we don’t know how the current p/e ratio for the SPX compares with the p/e ratios at the market peaks in 2007 and 2000 and 1929. What we do know is that the current p/e ratio is significantly understated relative to the p/e ratios in 2007 in 2000 because earnings are overstated relative to those years because of the accounting gimmicks that enable companies to boost GAAP non-cash earnings. It could be that the current p/e ratio is the highest on record if we could make an “apples to apple” comparison of p/e ratios across time. In fact, I would assert that applying standardized GAAP across time would prove that the current market is more overvalued than at any time in U.S. history.
The above analysis is an excerpt from my latest issue of the Short Seller’s Journal. In this issue I presented two retail stock ideas for shorting. One of them was down 3.7% today and the other was down just under 1%. In the past couple of issues I have explained in detail why the retail sector is short opportunity right now. But that window will close quickly as more companies do what happened to Macy’s and Kohl’s last week. You can get more details on the SSJ and subscribe clicking on this link: Short Seller’s Journal.
….related: Marc Faber: Investors are on the Titanic but there’s still a few days to travel

-
I know Mike is a very solid investor and respect his opinions very much. So if he says pay attention to this or that - I will.
~ Dale G.
-
I've started managing my own investments so view Michael's site as a one-stop shop from which to get information and perspectives.
~ Dave E.
-
Michael offers easy reading, honest, common sense information that anyone can use in a practical manner.
~ der_al.
-
A sane voice in a scrambled investment world.
~ Ed R.
Inside Edge Pro Contributors

Greg Weldon

Josef Schachter

Tyler Bollhorn

Ryan Irvine

Paul Beattie

Martin Straith

Patrick Ceresna

Mark Leibovit

James Thorne

Victor Adair