
Asset protection
“The Dow, S&P and Nasdaq have made record highs. More importantly, the Transports have as well.
Does this define a new bull market?”
The following is part of Pivotal Events that was published for our subscribers December 8, 2016.

Perspective
The intriguing headline is about the central banker observing that the market is on the “cusp” of a rise in interest rates. Following the exceptional technical excesses clocked in June, long rates have been rising. Also since then, short rates such as Libor have also been increasing.
Perhaps, the official is indicating that the Fed has no alternative but to follow the increase in market rates with an increase in the administered rate. No surprises, as typically the Fed follows the market by many months. Also, most government institutions will be hostile to Trump. The Fed could raise rates to “get even”.
Too many commentators out there still believe that the market rise is discounting the Fed change. Pathetic. It’s been forcing the Fed’s hand.
When the market reversed, we did not bother to provide a rational. Rates would just go up. In retrospect, it’s been associated with a turn to positive attitudes. Which in turn includes the electoral win by the popular uprising. A distinctly pro-business administration is a big positive.
As we have been noting, this is early in another Great Reformation which will reform yet another tedious experiment in unlimited government.
Very good stuff, but how much is in the market?
Mister Technical can advise us.
Stock Markets
The Dow, S&P and Nasdaq have made record highs. More importantly, the Transports have as well.
Does this define a new bull market?
New bull markets are called at the bottom. In January, our call was for a rally, particularly for the resource sectors. The big “Rotation” made outstanding gains into mid-year. After a correction and pause into late October, which seemed appropriate, the stock market exploded. Election results have been assisted by curve-steepening, which since July has been good for the banks. After a brief pause, spread narrowing has continued, contributing very much to the party.
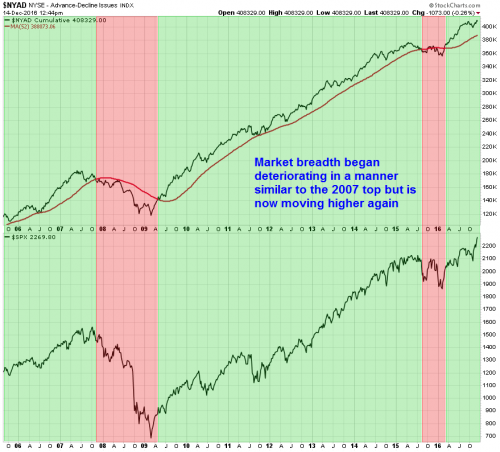
In looking at the broad market, the NYA is approaching the high reached in 2015, which is a test of the big Rounded Top.
In calling the election result, we have been impressed with the buying in anticipation of the remarkable reformation that has only just started. Financial markets are moving much faster than the actual reformation, which is and will be seriously fought by the establishment.
The win by the establishment would have been the next step towards a one-party system, including a state-run media and judiciary. The Left thought it was as good as won and is furious with the loss. Like rust, socialism never sleeps.
With the election result, we acknowledged the positives and advised we would let the technicals guide us. We had thought that whatever was declining would clear in November. This week the rise is becoming impetuous.
The TRAN has generated strong Upside Exhaustions plus a Sequential Sell and is eligible for a good correction. Banks (BKX) have accomplished similar excess.
However, the sharp rallies in KOL, marijuana stocks and base metals were impetuous enough to suggest another “silly season”. The will to speculate is very much in play. This week’s update on the Fear & Greed Index is important. Anything in the 75 to 80 level indicates a top, and it has jumped to 84.
A correction is possible and could start within a few weeks.
What does this do to the Dow Theory, which worked so well for us last year?
Precious Metals
There seems to be two problems out there.
The theory that the Fed can depreciate the dollar at will has not been working. The gold bug theory that this would drive gold to $10000 has not been working either.
We will stay with our methodical approach, which is that the 2007 blowout was a classic bubble. This was confirmed by the most severe contraction since the 1930s. In which case, the increase in gold’s real price would drive a bull market for the precious metals sector. This has been one of the features of previous post-bubble contractions back to the 1720 example.
The first post-bubble bull market for the sector ran until 2011, when the play became the most overbought since the blow-off in 1980.
The second bull market began last January and became overbought enough in July to call for a significant correction.
The next phase of the cyclical bull market could start soon. Gold stocks relative to the bullion price continue to improve.
Last week, we noted that this ratio would have to get above the 50-Day ma. With this, one could begin to accumulate the sector.
That was at 163, but the moving average is declining and is at 160. The ratio is acting well and up to 157.
We are almost there.
….also: Trump Rally and Irrelevant Dow Theory; what’s next Stock Market Crash
Listen to the Bob Hoye Podcast every Friday afternoon at TalkDigitalNetwork.com

Bullish Outlook
Dave Nicoski is optimistically predisposed to the health of the economy as stocks, the US dollar, interest rates, and oil rise together. He correlates this phenomenon to a “post-World War 2” era when “markets reversed and broke out to new highs right around the ’45-46 period.”
On risk, Dave says the US economy is “truly into a bond bubble,” with “1.7 trillion dollars wiped out of the market” since elections. Equities probably have “advanced to a level in many of those areas in terms of when the rubber meets the road on infrastructure spending,” setting up opportunities for pullbacks in those areas.
…also from Martin Armstrong:

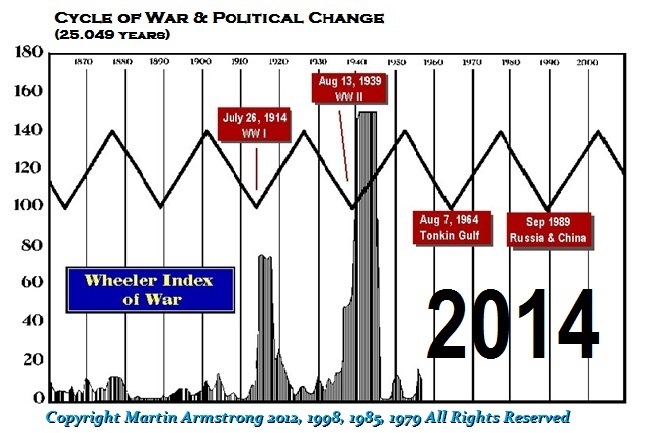
QUESTION: Mr. Armstrong; you previously wrote that if Trump were elected he might be assassinated. Do you still see that as a potential?
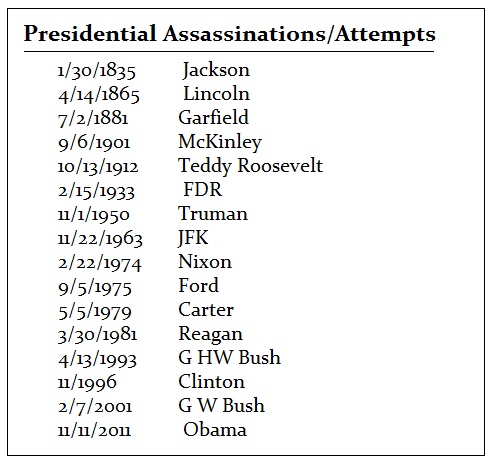
ANSWER: Absolutely. There is an 11-year average cycle for attempts to assassinate the president. Here is the list below:

The word “collapse” instantly conjures primal feelings of both fear and excitement whenever we hear it. We fear it because it evokes our collective belief that collapse is fatal and final, yet it excites our imagination to the possibility, however, remote, that perhaps we’ll be among the lucky few to survive and even prosper from it.
Whether in reference to a financial market crash or the collapse of government, the very idea has given birth to a plethora of writings on the subject. Indeed, some of the top selling books in the financial literature category in recent years have had collapse as the subject matter, for writers instinctively know they can always count on a visceral reaction from their readers whenever they write of it.
Interview Clif Droke on Safe-Haven Selloff, Muni Bond Crash
Laying aside the fear it evokes, the study of collapse is a fascinating and rewarding endeavor. Historians have long known what financial writers have only recently discovered, viz. that writing about collapse is a lucrative industry. Consider the hundreds of books dedicated to the decline and fall of the Roman Empire, or to any number of past civilizations (Aztec, Egyptian, Babylonian, etc.). One of the great preoccupations of writers of this genre is the guessing game of what exactly causes a society or an economy, to collapse. There is invariably no consensus among historians as to how, or even when exactly, it happens.
Consider the famous example of ancient Rome. What was it that actually precipitated the decline and fall of this mighty empire? While there have been hundreds of reasons offered by specialists as to the cause(s), the most commonly assigned factors can be generally summarized as follows: 1.) Immigration and assimilation of foreigners (i.e. barbarians), 2.) Failure to continue expanding the frontiers via military conquest, 3.) Loss of personal discipline and liberty; 4.) Corruption on both the administrative and personal levels.
Even if we accept any, or all, of these reasons as being legitimate, it still doesn’t answer the perennial question of what led the Romans to decide on making such a fateful decision. In other words, what was the ultimate reason for the decline and fall?
Financial writers are plagued by the same lack of agreement as to what causes markets to collapse. The reasons they offer range from the prosaic to the profound. Most commonly they assume that a market collapse is the result of asset prices being “too high” or unsustainably expensive relative to valuation. What many don’t realize is that demand for any given asset can extend well beyond the boundaries of normal valuation for years, or even decades, at a time. We need to look no further than the Treasury bond market to see an example of this.
It has become fashionable among collapse historians to assume that collapse often occurs without warning out of a clear blue sky as it were. Nothing could be further from the truth. Collapses are invariably preceded by long periods of internal weakness, whether it’s the financial market or any other social system. This explains why strong societies, much like strong markets, can withstand any number of external shocks without toppling. It’s only when weakness is entrenched that one can expect external pressure to cause serious damage to a structure.
An example of this is the stock market plunge of late 2015/early 2016. In the months leading up to it there was a sustained period of internal weakness and technical erosion in the NYSE broad market. The number of stocks making new 52-week lows was well over 40, and often in the triple digits, which was a clear sign of distribution taking place in some key industry groups. This weakness was evident in the NYSE Hi-Lo Momentum (HILMO) indicators, which depicted a downward path of least resistance for stocks. The following graph is a snapshot of what the HILMO indicators looked like in the weeks just prior to the January 2016 market plunge.

This is also what stock market internal momentum looked like prior to the 2008 credit crash. In fact, it’s what precedes every major collapse and it’s also a good representation of the internal weakness which takes place before markets, societies and empires collapse. Look below the surface and you’ll always see the internal decay which paves the way for the coming destruction. A healthy and thriving system, by contrast, is simply not conducive for a collapse to occur.
When we view the internal structure of the current NYSE stock market through the lens of the HILMO indicator, what do we see? A market ripe for collapse? Far from it, we see overall signs of technical health – even if the market isn’t firing on all cylinders. Below are all six major components of HILMO. The orange line is the longer-term momentum indicator, which is one of the most important one for discerning whether or not the market has been undergoing major distribution (i.e. internal selling). It has been rising for several months now and is the polar opposite of what it looked like heading into 2016.

It would appear then that a collapse isn’t on the menu right now, at least not in the intermediate term outlook. If it happens at all it will require a significant reversal of the market’s longer-term internal momentum currents, which in turn would likely take several months. The weight of evidence suggests that the doom-and-gloomers who are predicting collapse are much too early and should save their apocalyptic warnings for a more propitious time.
…related: The Yield That Breaks the Trump Rally’s Back
Mastering Moving Averages
The moving average is one of the most versatile of all trading tools and should be a part of every investor’s arsenal. Far more than a simple trend line, it’s a dynamic momentum indicator as well as a means of identifying support and resistance across variable time frames. It can also be used in place of an overbought/oversold oscillator when used in relationship to the price of the stock or ETF you’re trading in.
In my latest book, Mastering Moving Averages, I remove the mystique behind stock and ETF trading and reveal a completely simple and reliable system that allows retail traders to profit from both up and down moves in the market. The trading techniques discussed in the book have been carefully calibrated to match today’s fast-moving and sometimes volatile market environment. If you’re interested in moving average trading techniques, you’ll want to read this book.
Order today and receive an autographed copy along with a copy of the book, The Best Strategies For Momentum Traders. Your order also includes a FREE 1-month trial subscription to the Momentum Strategies Report newsletter: http://www.clifdroke.com/books/masteringma.html

 In 2012 I wrote a book called “The Coming Bond Market Collapse”, in that book I predicted that the bond market would begin to collapse by the end of 2016. Clearly, this prediction has started to come true. However, in all candor, I never dreamed that the Ten-year Treasury yield would plummet to 1.3%. Neither did I ever imagine that over thirteen trillion dollars’ worth of global sovereign bonds would have a negative yield, as was the case this past summer.
The Book’s assumption was that the bursting of the bond bubble would be caused by a change in global central banks’ monetary policy or through the eventual achievement of their inflation targets. At this juncture-at least in the U.S. — we have both. The Ten-year Treasury note has risen 80% since July based on both the return of inflation and the Fed’s desire to raise interest rates.
This begs the question: how high could interest rates climb and what is the interest rate that will break the Trump rally’s back?
Back in 2007, before anyone knew what the phrase Quantitative Easing meant, nominal GDP was around 5%, our National Debt was $5.1 trillion (64% of GDP) and the Ten- year was 5% — there is a strong correlation between nominal GDP and the 10-year note. Therefore, without any central bank-manipulation of long-term interest rates, it would be logical to conclude that the rate would rise back towards the 5% level as long as Mr. Trump can produce real growth of 3% and inflation around 2%. But, given today’s $20 trillion of National Debt, which is north of 105% of GDP, and the condition of soaring annual deficits, it would be prudent for bond investors to require an even higher yield than 5%.
The U.S. budget deficit has started to rise due to unfavorable demographics and an economy that is already suffering from a debt-disabled condition. The deficit for fiscal 2016, at $587 billion, was 34% higher than 2015. And the projected fiscal deficit for 2017 is $616 billion dollars, but that is before we factor in the new administration’s tax cut and spending plans.
The Committee for a Responsible Federal Budget (an independent organization) estimates that Trump’s tax plan will add 4.5 trillion dollars to the deficit over the next ten years. That could add an additional $450 billion to the annual red ink.
Adding to this we have borrowing costs on the rise. For every 25 basis point increase in rates, there is a $50 billion addition to the deficit. Given that the National Debt was financed at an average rate of 2.21% last year, the current increase in yields experienced already could add an additional $50 billion to the interest expense. In fact, the Congressional Budget Office sees the annual tab for interest on the debt doubling between now and 2020. Then we have Donald Trump’s massive one trillion-dollar, ten-year infrastructure plan.
Therefore, assuming much of Trump’s fiscal plans get passed in the first 100 days in office, the back-of-the-envelope estimate for 2017 would be: $616 billion baseline deficit, add $450 billion for tax cuts, at least $50 billion for additional interest and another $100 billion for infrastructure/defense spending. You don’t need a master’s degree in math to conclude that deficits could increase to well over one trillion dollars rather early in his administration.
But that’s not all; we have another risk that could add to the deficit. The current business cycle has been the longest economic expansion since WWII. The average expansion is 38 months, and the current one is already 90 months in duration. Therefore, a recession sometime in 2017 is more than overdue.
If we did enter an economic contraction next year deficits could explode by an additional $1.2 trillion; just as they did during the Great Recession of 2009.
With deficits more than likely north of $1 trillion dollars — or north of $2 trillion dollars if we enter into a recession — there could be a massive and record supply of debt issuance that will put enormous upward pressure on yields.
Adding to this dynamic is the waning demand for U.S. debt from China.
Data from the Treasury shows that China, the largest owner of US government debt, has cut its holdings every month between May and September of this year. And this was before the infamous phone call from Taiwan’s Prime Minister to the President Elect and any Twitter war Trump may start with China. In fact, in May alone the Peoples Bank of China sold a net $87 billion dollars in Treasury debt.
Therefore, not only is the Fed threatening to resume its tightening cycle come December 24th, but the bond market will have to absorb China’s liquidation of its stash of Treasuries as well.
In fact, the only condition still preventing the bond market from an immediate implosion is the QE coming from the European Central Bank (ECB) and the Bank of Japan (BOJ). However, the ECB has just indicated that it will reduce its bond purchases starting March 2017. And In Japan, Hakubun Shimomura, a senior member of the ruling Liberal Democratic Party said recently, “If the yen weakens too much, import prices go up. I hope the yen doesn’t get much cheaper than its current level.”
But the bottom line is there’s no way the current total of QE coming from the ECB and BOJ can offset the awakening from the 35-year old comma of bond vigilantes. Once they decide the $100 trillion global market is a sell…the game is over.
As the ten-year yield approaches 3%, which is more than double the rate seen just five months ago, all forms of fixed income, along with their proxies, will come under extreme pressure. This means; corporate debt, municipal bonds, REITs, CLOs, student and auto loan securities, bond funds, the real estate market, all dollar-denominated foreign debt and equities will fall concurrently along with the global economy. All this should occur while the multi-hundred trillion dollar interest rate derivative market gets blown to smithereens.
Simplifying the tax code and reducing regulations are necessary steps in restoring America to greatness. But by no means will Trump’s economic plans offset the bursting of an epic bond bubble that was 35 years in the making. Nor will protectionist trade policies and massive deficit spending rectify the economic imbalances manifest from 8 years’ worth of artificial credit offered for free.
The earnings yield on the S&P 500 is falling just as the yield on the 10-year is rapidly rising. Therefore, equity risk premiums are inexorably dropping towards the flat line. A 3% Ten-year Note yield may be enough to blow the whole economic bubble sky high.

-
I know Mike is a very solid investor and respect his opinions very much. So if he says pay attention to this or that - I will.
~ Dale G.
-
I've started managing my own investments so view Michael's site as a one-stop shop from which to get information and perspectives.
~ Dave E.
-
Michael offers easy reading, honest, common sense information that anyone can use in a practical manner.
~ der_al.
-
A sane voice in a scrambled investment world.
~ Ed R.
Inside Edge Pro Contributors

Greg Weldon

Josef Schachter

Tyler Bollhorn

Ryan Irvine

Paul Beattie

Martin Straith

Patrick Ceresna

Mark Leibovit

James Thorne

Victor Adair