Asset protection

Trump Makes The US Stock Market Great Again

The broad US stockmarket actually looks better overall than it has done for several years, which may come as a surprise considering it has been in a bullmarket since as far back as early 2009. On the 10-year chart for the S&P500 index we can see that a potential top area developed from early 2015 through the middle of this year, which has now been aborted by recent gains that have seen it break clear above resistance at earlier highs. This index remains within the big parallel channel that started to form back in 2010 – 2011 and appears to have its sights set on a run to the upper boundary of the channel again, which will result in BIG gains from the current level. Whilst we can speculate about the fundamental reason or reasons for such a move – a Trump spending spree, hot money flowing out of embattled Europe and possibly the Mid-East and Japan into the US, and helicopter money, such pondering is largely a waste of time – the chart says the market is set to advance and quite a lot, and that’s what matters. This is a big change from several months back or even several weeks back, when it looked toppy and vulnerable. 

spx10year291116

The 4-year chart enables us to see how the market gradually rounded over beneath a giant Dome pattern, but then broke clear above it in the Spring of this year. Observe how, after this happened, and it advanced away from the Dome, it then dropped right back to test support at the Dome boundary before advancing again. This was a very deceptive move, given that it looked like it had topped out at the resistance at the highs, and thus was a buying opportunity that many missed out on. Like Russian dolls, a Dome pattern of lesser magnitude then formed during this year, which involved the market breaking out to new highs in the Summer before this Dome boundary forced it back down again, but Trump’s unexpected victory caused this Dome to abort too, and after its recent sharp advance the market is now “in the clear”, having risen well above the considerable zone of congestion approaching the 2015 highs. 

spx4year291116

On the 1-year chart we can see how the market was being forced lower by the Dome pattern that developed this year, but suddenly broke out of it on the Trump victory on strong volume, which was a bullish development, and following the breakout it has continued to push higher, breaking its Summer highs at the top of the Dome as moving averages swing into bullish alignment. 

spx1year291116

On the 3-month chart we can see recent action in detail and how jitters ahead of the election caused the market to drop sharply, until a bullish “inverted hammer” right at the 200-day moving average heralded a reversal, which occurred on the Trump victory when a gap up into a giant white candle signaled the birth of a new uptrend. After rising almost vertically for a few days, a move which punctured the Dome boundary, the market settled into a more orderly, if still steep uptrend. Now it is getting overbought on various oscillators so it would not be surprising to see it break down from this uptrend to enter a period of consolidation or reaction, although any reaction is likely to be minor before the larger uptrend resumes. 

spx3month291116

Conclusion: the market appears to be starting out on another major upleg within the giant parallel uptrend channel shown on the 10-year chart above, on which you will also find a prospective target for this uptrend, that is a long way above current levels. If this interpretation is correct, any short-term reaction will present a buying opportunity.

….also:

The Fat Lady Is Singing For The Bond Market

Stock Trading Alert: New Record Highs, But Will The Uptrend Continue

Originally published November 28,  2016, 6:53 AM:

Briefly: In our opinion, speculative short positions are favored (with stop-loss at 2,240, and profit target at 2,060, S&P 500 index).

Our intraday outlook is bearish, and our short-term outlook is bearish. Our medium-term outlook remains neutral, following S&P 500 index breakout above last year’s all-time high:

Intraday outlook (next 24 hours): bearish
Short-term outlook (next 1-2 weeks): bearish
Medium-term outlook (next 1-3 months): neutral
Long-term outlook (next year): neutral

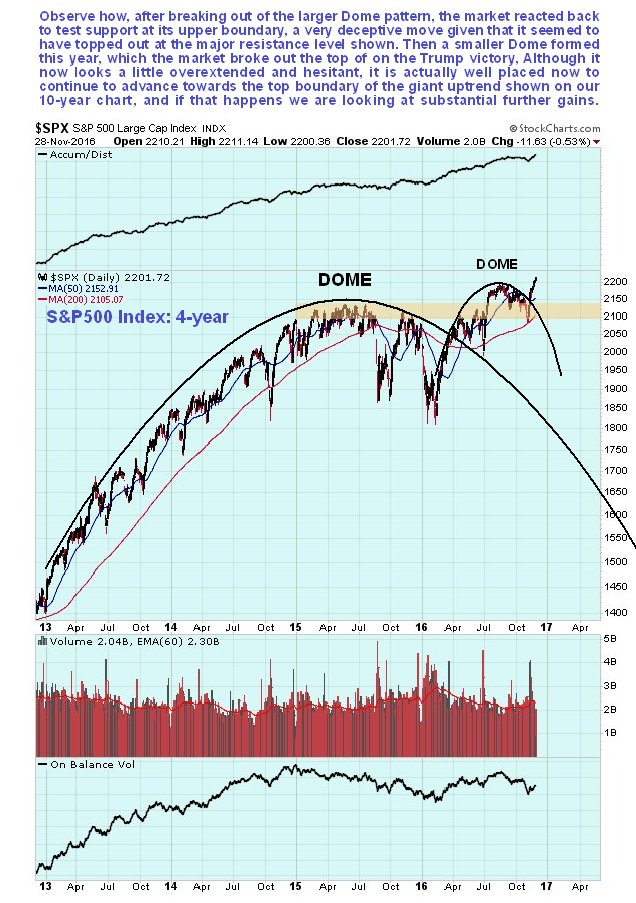
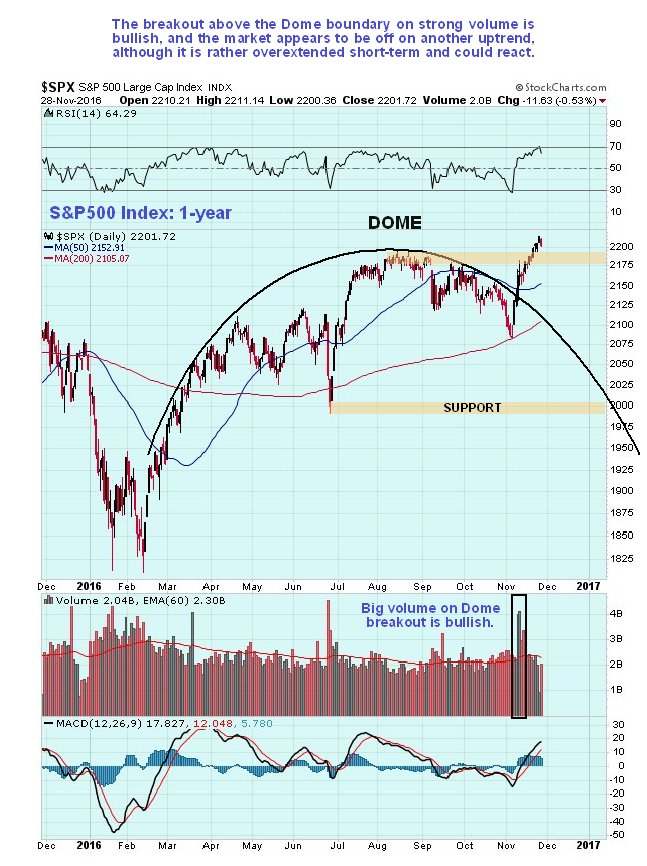
The U.S. stock market indexes gained 0.2-0.4% on Friday, extending their short-term uptrend, as investors’ sentiment remained bullish following presidential elections outcome. The S&P 500 index has reached yet another new all-time high at the level of 2,213.35. The nearest important support level is at 2,190-2,200, marked by previous level of resistance. The next important level of support remains at 2,170-2,180. The market continues to trade along its medium-term upward trend line, as we can see on the daily chart:

1
Larger Image

Expectations before the opening of today’s trading session are negative, with index futures currently down 0.2-0.3%. The main European stock market indexes have lost 0.6-0.7% so far. The S&P 500 futures contract trades within an intraday consolidation, as it retraces some of its Friday’s advance. The nearest important level of resistance is at around 2,210, marked by local highs. On the other hand, support level is at 2,200, and the next level of support is at 2,190, marked by some previous local lows:


2
Larger Image

The technology Nasdaq 100 futures contract follows a similar path, as it currently trades along the level of 4,850. The nearest important level of resistance is at around 4,870-4,890, marked by local highs. On the other hand, support level remains at 4,830-4,840, marked by previous local lows, as the 15-minute chart shows:
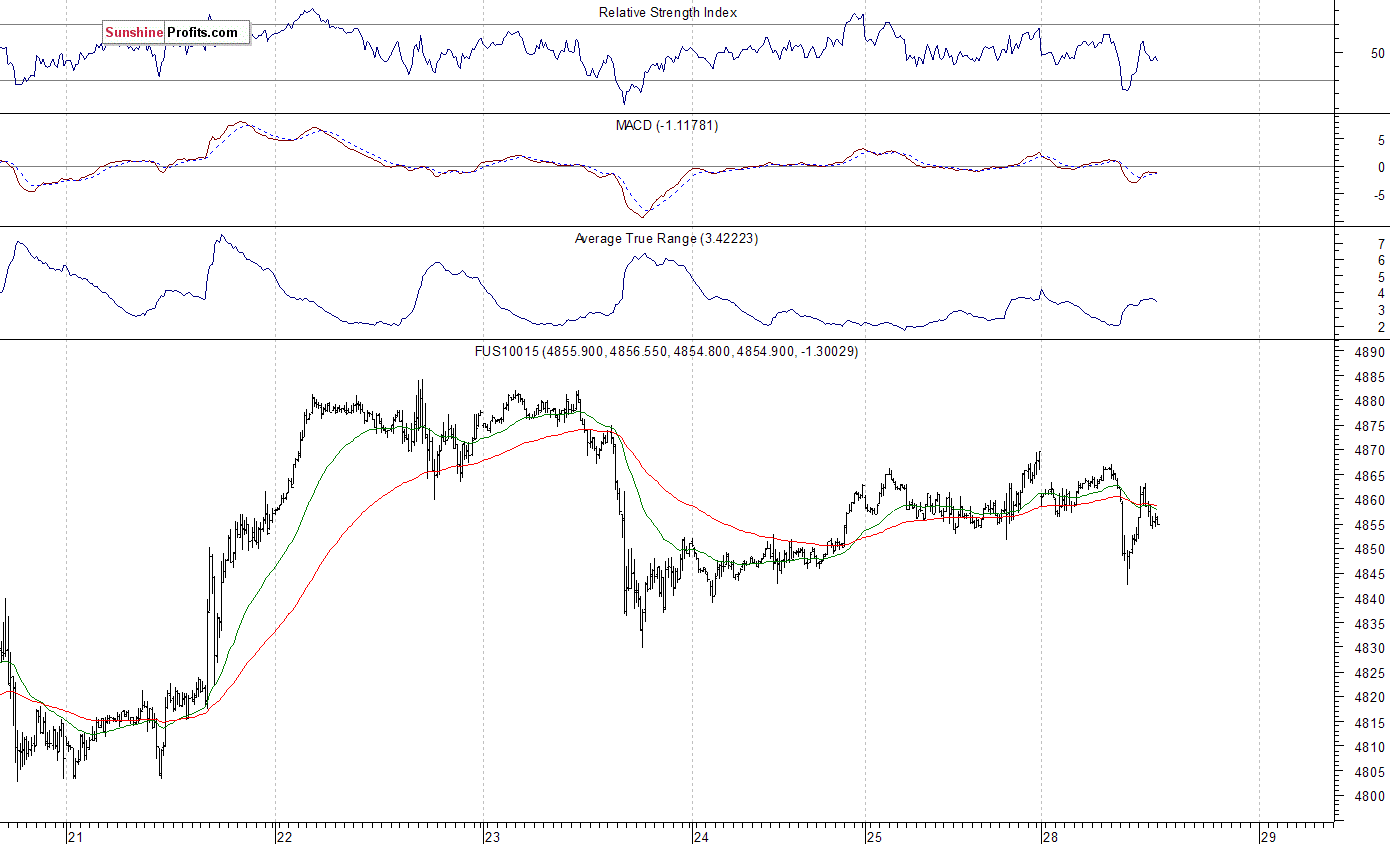
3
Larger Image

Concluding, the broad stock market continued its long-term uptrend on Friday, as the S&P 500 index reached new all-time high above 2,200 mark. We still can see technical overbought conditions. Therefore, we continue to maintain our speculative short position (opened on November 16 at 2,177 – opening price of the S&P 500 index). Stop-loss level is at 2,240 and potential profit target is at 2,060 (S&P 500 index). You can trade S&P 500 index using futures contracts (S&P 500 futures contract – SP, E-mini S&P 500 futures contract – ES) or an ETF like the SPDR S&P 500 ETF – SPY. It is always important to set some exit price level in case some events cause the price to move in the unlikely direction. Having safety measures in place helps limit potential losses while letting the gains grow.

To summarize: short position in S&P 500 index is justified from the risk/reward perspective with the following entry prices, stop-loss orders and profit target price levels:

S&P 500 index – short position: profit target level: 2,060; stop-loss level: 2,240
S&P 500 futures contract – short position: profit target level: 2,055; stop-loss level: 2,235
SPY ETF (SPDR S&P 500, not leveraged) – short position: profit target level: $206; stop-loss level: $224
SDS ETF (ProShares UltraShort S&P500, leveraged: -2x) – long position: profit target level: $18.38; stop-loss level: $15.64 (calculated using trade’s opening price on Nov 16 at $16.6).

Thank you.

….also from Sprott Money: This Is Where I Get Off

The Fat Lady Is Singing For The Bond Market

saupload TLT-3-e1479265537904Summary

You have just been adopted by a new rich uncle.

I doubled my short position in the US Treasury bond (TLT) market today.

I’ll be using any subsequent price rise to sell more bonds, roll forward puts and put spread options, sell short bond futures, and buy the Ultra Short Treasury Bond (TBT).

It is undoubtedly the cleanest trade out there in the world today. Of all the momentous changes in the prospects for asset classes as a result of the presidential election, bonds absolutely top the list. And not just US bonds, but German, Japanese, British, and every other kind of bond out there in the world as well are exiting a 30-year bull market and entering a 20-year bear market.

…read more HERE

…related:

Bond Carnage hits Mortgage Rates. But This Time, it’s Real


The Initial Rumbles of an Economic Earthquake

Trump, organized labour, the NDP and the rest of the progressive left want to get on board with national tariffs, making foreign goods more expensive for the consumer. Protecting jobs is the object even though a far greater attack on jobs comes from technological change for one. There are greater threats to jobs than NAFTA which is in Trumps gunsights. Besides, anything the Teamsters union is in support of is not likely to be in Canadian Citizens interest.

…more from Michael: A Dangerous Dark Storm Brewing

1naf1


As The Monetary Madness Continues, What Is Happening Is Stunning…

King World News note:  Mortgage rates based on the 10-Year Treasury have been headed dramatically higher as bonds plunge 

KWN-Boockvar-II-11162016

To quantify, at last Monday’s 30 yr rate of 3.47%, a $300k mortgage would have a monthly payment of $1,342.12. At the 3.88% rate, the monthly payment would increase by about $70 to $1,411.57, a 5.2% increase.

…continue reading HERE