
Asset protection
While so many people claimed that Quantitative Easing (QE) would produce inflation for it was the creation of money, the truth is very far from this simplistic idea. The theory used by the central banks is seriously flawed and throw-back to ancient times before 1971. There use to be a difference between debt and cash when you could not use debt as cash to borrow on. Then it was less inflationary to borrow than to print. But that changed post-1971 and today if you want to trade you post TBills as cash. The REPO market has emerged where AAA securities can be borrowed against for the night.
Therefore, buying in bonds to inject cash into the system under the old way of running the monetary system pre-1971 made sense. Today, it is proving to be a FOOL’S GAME. Why? This is merely swapping debt for cash and the REAL money supply has not increased when the true definition of the base money supply in effect reality is debt + cash. Then you add the leverage from banking.
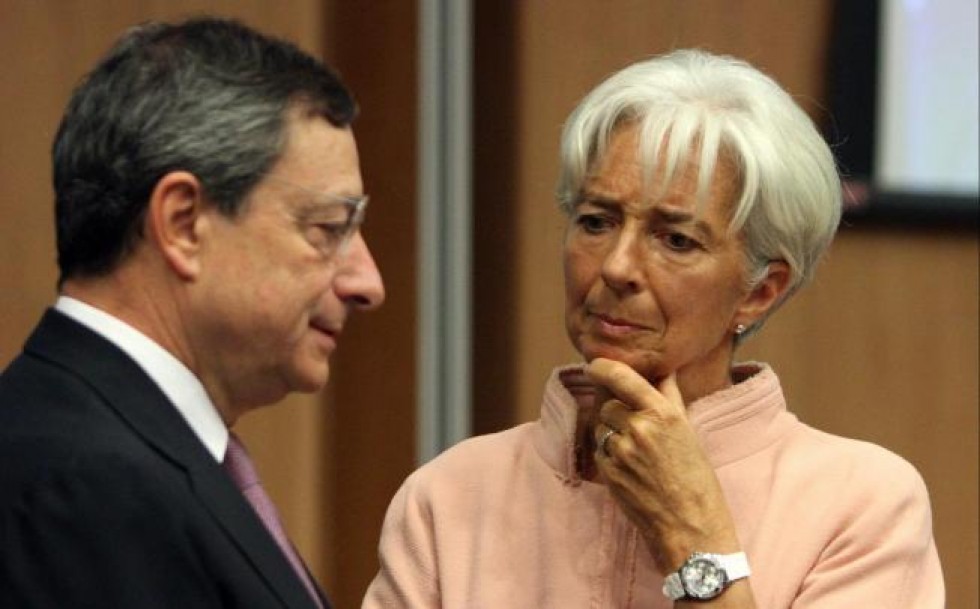
So what does this new reality mean? This is why the BONDS may not crash but instead become extinct. Under QE the central banks are the bidder supporting the market in the same stupid manner as attempting to peg a currency. The ECB under Draghai has lost its mine. They keep increase the percentage of bonds they are buying in hopes of creating inflation but nothing is working. The bonds will not crash, but instead, they could become
extinct. In order for a crash to materialize, there has to be a free market.
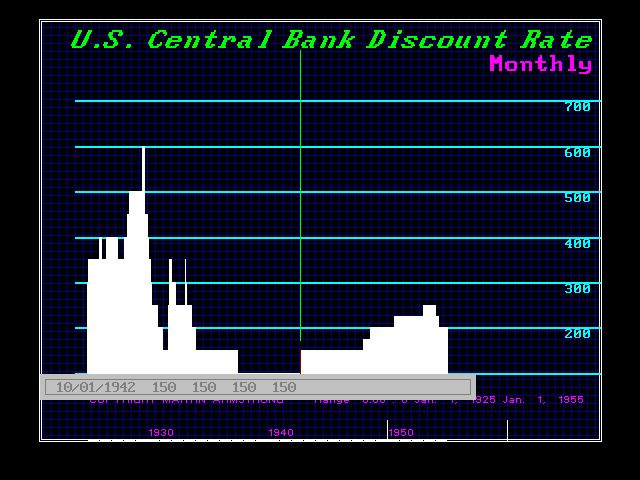
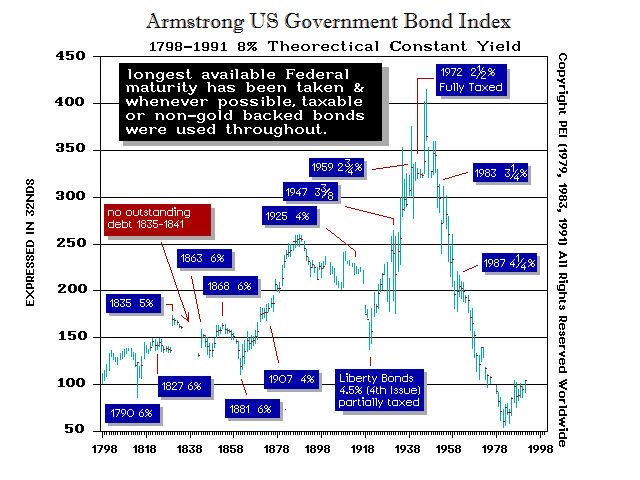
Little known to most analysts that during World War II, Congress ORDERED the Federal Reserve to do something similar to QE. The declared the Fed MUST support the bond market during the war and be the constant buyer at PAR. The market went sideways during the war and what we see is a flat line.
 In the case of the central bank artificially supporting the bond market during World War II, that decree was lifted in 1951. Our present situation is different insofar as the central banks have bought in all the long-term debt so there is a shortage of debt in the short-term. This is also why the Fed is accommodating the banks paying 0.25% on excess reserves.
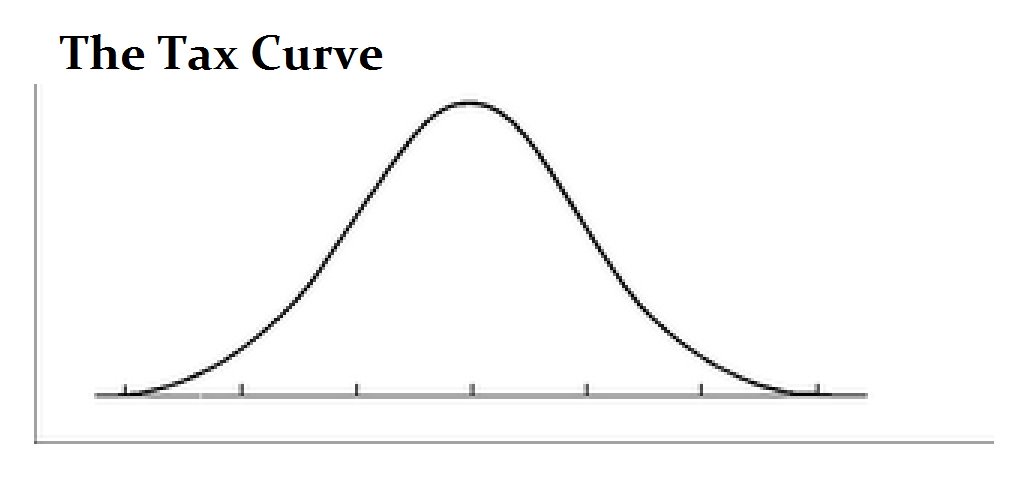
In trying to figure out this Rubic Cube mess they have created trying to cunning and stalking the financial market like a cat, the truth is rather scary. The rise in taxation is destroying the economy. Ancient Egypt is considered by some to have been the most heavily taxed nation in history and this was the primary reason it collapsed under the weight of the levies imposed on the populace that destroyed its economy weakening the nation from the inside out.
This time, unlike 1951, we are at the extreme in economic destruction by the state in their hunt for taxes. Payroll taxes were just introduced for the war. It was postwar when taxes were reduced in 1951 and the economy began to take off. We are exactly on the opposite side of the curve with rising taxes. This warns that we are in a collapsing side of the Bell Curve.
It is like alcohol. A little is good and too much kills you. Studies have shown that people who drink a little are healthier than those who drink too much or none at all. This time, with taxes rising, there is a contracting global economy and we are in serious trouble, The central banks have bought in the debt rather than declaring they will support the market. This means that they will not have a market to reverse the position and sell the debt they bought in. This means that a sovereign default wipes out central banks as well. Hence, the long-end of the market is being systematically rendered extinct.
We may see the bonds crash in price to the extent that people are not interested. However, the central banks will have to buy in more and more debt. This raises the risk of “conversione forzosa” whereby even if you bought 30 day government paper, they simple decree they will not repay that obligation for 10 years. They can simply convert short-term to long-term. We are more likely to see this type of action before any real reform.
also from Martin:
IMF Warns Saudi Arabia May Go Bankrupt by 2020

 The man who forecast $5,000+ gold prices for 2016 back in 2009 (click here), and whose cycle model predicts a big disruption in global financial markets at the close of this month, has spoken out against the Federal Reserve’s decision to keep interest rates on hold last week..

Nothing much to report from the stock market yesterday. Investors are regaining their calm.
A few weeks ago, it looked as though the end of the world had begun.
We are talking, of course, about the world in which credit, stocks, and central bank reputations only go up.
But after a big fright in August, investors recovered their relaxed madness. They concluded that there was nothing to worry about.
They may be right. You never know. But our guess is that the end of the world has already begun… and they just can’t face it.
Disappearing Growth
Since the end of World War II, credit has been expanding in the U.S.
At first, it was a healthy expansion. Young, middle-class families took out mortgages and ran up bills on “charge cards,” such as Diners Club and American Express.
Then, in the late 1950s, came the first credit cards. This was accompanied by large increases in consumer credit.
Until the 1970s, all was well, because wages were rising, too. And with so much new technology coming online, people believed their wages could only increase.
Debt was no problem – neither for the nation nor for households. We would “grow our way out of it.”
But a strange – and as yet not fully understood – new trend began in the 1970s. After accounting for inflation, incomes for most Americans dramatically tapered off.
The economy was slowing, too, after taking the effects of inflation into account.
At first, this was thought to be temporary – a fluke, perhaps caused by the 1973 oil crisis. But the trend toward lower economic growth continued. Decade after decade, the trend in GDP growth was down. In most parts of the U.S., GDP per person peaked in the 1970s or 1980s.
Remarkably, the average American working man earns less today than he did a half century ago (again, accounting for changes in consumer price inflation).
That is not the same as saying that a person with a good job earns less today than he did in the 1960s. According to Census Bureau figures, the average inflation-adjusted wage for Americans in the top 5% of earners is up by more than 75% since 1967. Women earn a lot more, too.
But good jobs have become scarce. The labor participation rates – the number of people who have jobs or are looking for jobs as a percentage of the people who are of working age – is at its lowest level since 1977.

Debt Goes Sour
But although economic growth and most people’s incomes slipped, debt (the flip side of credit) kept growing.
This was Stage II – the unhealthy phase of the credit expansion. No longer backed by broad-based wage increases, debt was expanding beyond the capacity of the economy – and borrowers – to repay it.
Now we were asking for trouble.
You may be wondering how this was possible. Why would lenders extend credit to people who couldn’t pay back?
The answer: The fix was in.
In 1971, President Nixon dramatically transformed the global monetary system. Under the previous Bretton Woods system, the dollar was backed by gold. And the major global currencies traded at fixed rates to the dollar… and by extension to gold.
This meant a nation couldn’t get too far into debt… especially when it came to its trading partners.
Trade surplus nations – which amassed dollars in return for net exports to the U.S. – could ask to redeem their dollars in gold. This caused gold to leave the overspending nation and flow to the creditor nation.
That’s how the U.S. got so much gold in the first place. France and Britain spent more than they could afford on World War I. The U.S. sold them food, weapons, and fuel… and demanded gold in repayment.
But by the 1960s, the shoe was on the other foot.
The U.S. started spending money on both “guns and butter” – a Great Society at home and a war in Vietnam.
Much of the spending to fund the war in Vietnam ended up as dollars in the hands of Vietnamese branches of French banks. And when, in 1965, president Charles de Gaulle sent the French navy across the Atlantic to pick up $150 million worth of gold in exchange for dollars, it was greeted like a long-lost relative at the reading of the will.
Finally, with gold being airlifted from Fort Knox to meet foreign demands for payment, rather than honor Washington’s promise to convert dollars to gold, Nixon panicked and defaulted.
Henceforth, anyone holding dollars was on his own…
“Tall Paul” Takes Over
It all would have gone bad very fast. By April 1980, the annual rate of consumer price inflation was running at almost 15%.
Gold soared as high as $800 an ounce. It looked as though Nixon’s new fiat money system would go off the rails soon – as all previous experiments with paper money had.
Instead, in 1979, President Carter appointed Paul Volcker as Fed chairman. Volcker stepped in front of the runaway train and commanded it to halt. And it did…
By January 1981, “Tall Paul” jacked up the federal funds rate – the key lending rate in the economy – not to 2%… or 4%… or even 8%. He set it at 19% – and placed the train squarely on the tracks again.
We remember the howls of discontent. Volcker was “stifling the economy,” said the politicians. He was “killing jobs,” said the newspapers. He was causing “the worst downturn since the Great Depression,” said the economists.
But Volcker didn’t budge. And when Ronald Reagan entered the White House in 1981, he backed Volcker.
Volcker announced his intention to squeeze inflation out of the system soon after he became Fed chairman.
Bonds – which do well when inflation is low – should have rallied. Investors should have raced to lock in roughly 10% yield available on the 10-year Treasury note.
Instead, bonds price fell… and bond yields rose.
Then, as now, people were not aware – or were not willing to believe – that a major change had occurred. It wasn’t until 1982 that the bond market turned; finally, investors realized that it was a new world.
Volcker saved the system. Bond yields – and interest rates – have been coming down ever since.
Too bad he didn’t save a better system.
Not many men can resist the appeal of free money. Americans proved they were no better at it than others.
Falling interest rates and the paper dollar gave them a way to impoverish themselves – by spending money they hadn’t earned.
They took the opportunity offered to them. They borrowed and spent… and drove the entire world forward at a furious pace.
But now that stage is over.
More to come…
Regards,
Bill
Market Insight
by Chris Lowe
U.S. industrial production just hit its lowest level since 2008.
Today’s chart is of the Fed’s closely watched Industrial Production Index. It measures total output from the U.S. manufacturing, mining, electric, and gas industries.
In September, growth in industrial production slowed to 0.4% compared to the previous year – inching dangerously close to negative territory.

The last time this index turned negative, the U.S. economy was in recession (gray-shaded area on the chart).

The stock market crashes were – alongside the devaluation of yuan – the most important recent developments in China. The stock market started rising during the summer of 2014, when the property market started to burst. The timing is no coincidence, as the government wanted to replace one bubble by another. By inflating (or at least cheerleading) the stock market bubble (by cutting interest rates and providing liquidity into the markets via the Pledged Supplementary Lending and Medium-Term Lending Facility, the Chinese version of quantitative easing both worth over the 2 trillion yuan), the Communist Party of China wanted to sell equity stakes of dangerously debt-burdened state enterprises and help clean up messy balance sheets, as well as to create a wealthy middle class, as a condition to move from exports/investment-led growth to domestic-consumption-led growth. Additionally, the start of the property market burst limited a viable investment opportunity for domestic investors, prompting them to reallocate their capital into the stock market. Consequently, China’s stock market surged more than 150 percent over the year, hitting a seven-year peak in the middle of June. Since then, mainly due to deleveraging, the Chinese stock prices have dropped nearly 40 percent (despite all government’s measures to prevent declines), culminating in a one-day drop of 8.5 percent on August 24 (the devaluation of the yuan has also added uncertainty to the stock market and triggered outflows from the stock market due to selling a yuan).
The Chinese stock market’s drop caused a decline in commodity and equity prices around the world, erasing $3 trillion in value from global stocks. The question is now whether China’s stock market’s burst spreads further into other markets and significantly affects the global economy and the gold market. Well, there are many arguments for saying that the burst of the stock market is less serious threat that the ongoing burst of the property market. Why? First, the PBOC and the regulators constantly pour liquidity into the markets. Second, the government launched a massive socialist-style rescue campaign and introduced many stock market regulations, limiting the potential decline. Third, the number of stock investors comprises less than 8 percent of the total Chinese population (while the home ownership rate is 90 percent). Fourth, the 0.03 percent of stock investors own 67 percent of the A-share market capitalization (A-share market combines shares traded in mainland China, which are available generally only to domestic investors). This means that the fate of the market depends not on the retail, non-educated investors, but on the bigger and smarter players. Fifth, the stock market is not the main channel to raise money in China. Equity funding is less than 5 percent of the total corporate financing pool (much lower than bonds and loans’ share) and it finances only about 2 percent of Chinese fixed asset investment. Sixth, stocks as a percentage of Chinese household financial assets amount to less than 15-20 percent (while real estate amounts to more than two-thirds of household wealth), so the declines should not significantly affect the real economy and consumption via the wealth effect (especially since the previous rally in the stock market did not trigger a boost in consumption indicating that gains remained largely unrealized).
However, it does not mean that the Chinese stock market’s performance is meaningless. Of course, the bust partially reflects the previous irrational exuberance not strongly tied to economic fundamentals, but the valuations of many companies rose due to the orgy of public spending and the real estate bubble. Therefore, China’s stock market crash should be viewed as a preview to the country’s coming crisis, when China’s credit and property bubbles will pop. This is why investors reacted so strongly to recent events in China – they could be a canary in a coal mine (usually, changes in stock markets reflect anticipated outcomes in the real economy) warning against the real crisis, which could potentially spark global contagion, and reminding global investors that stock markets all over the world are at unsustainable levels. During these times, valuations are so inflated for U.S. equity that the market is oversensitive to economic and financial news, therefore further declines in China’s stock market could trigger some chain reaction again, even if they are not a major cause for concern.
The chart below shows the performance of the Shanghai Exchange Market Composite Index and the price of gold. As one can see, there is no clear relationship between these two variables. Gold was gaining after the stock market crash in 2007-2008, however it was caused rather by weakness in the U.S. dollar and the U.S. stock markets. The current global economic situation seems to be more similar to the Asian/Russian crisis in 1997-1998 than to the Great Recession, so any potential gains due to safe-haven demand for gold may be capped by the upward pressure on the greenback.
Chart 1: The price of gold (London P.M. fix, red line, left scale) and Shanghai Stock Exchange Composite Index (green line, right scale) from 1997 to 2015

The key takeaway is that China’s stock market bubble came from developments in the property market, government meddling and irrational exuberance. The following crash is not likely to have major adverse consequences for China’s real economy, however it may be a preview of a coming crisis, which – given the current inflated valuations in global stock markets – may trigger some further bearish reactions. The bear market in stocks should be positive for the price of gold, however the appreciation of the U.S. dollar will likely exert downward pressure on the shiny metal. However, a lot “depends” and a lot “can change” in the meantime – we’ll keep monitoring the situation and describe the changes as they unfold.
Thank you.
Arkadiusz Sieron
Sunshine Profits‘ Gold News Monitor and Market Overview Editor
 “This bear market (and I’m calling it one) has developed a case of internal erosion. Stocks are falling apart one by one as the big averages mask the damage. Bear markets are sneaky beasts and they like to do their damage as secretly and as unobtrusively as possible. I hate to say it, but somewhere ahead the bears are going to get together and the innocent little stream is going to turn into a waterfall.
What can you do about it?”

-
I know Mike is a very solid investor and respect his opinions very much. So if he says pay attention to this or that - I will.
~ Dale G.
-
I've started managing my own investments so view Michael's site as a one-stop shop from which to get information and perspectives.
~ Dave E.
-
Michael offers easy reading, honest, common sense information that anyone can use in a practical manner.
~ der_al.
-
A sane voice in a scrambled investment world.
~ Ed R.
Inside Edge Pro Contributors

Greg Weldon

Josef Schachter

Tyler Bollhorn

Ryan Irvine

Paul Beattie

Martin Straith

Patrick Ceresna

Mark Leibovit

James Thorne

Victor Adair