
Bonds & Interest Rates
As promised, today we enter the time that hasn’t come yet… the point where the poor camel’s back gives way.
Yesterday, the Fed announced it would withdraw another $10 billion of artificial demand from the US bond market. And Janet Yellen let slip that the Fed would consider raising short-term interest rates about six months after QE ends.
The Dow fell 114 points. Gold dropped $17 an ounce.
What to make of it?
You’ll recall that, as long as ZIRP (zero-interest-rate policy) continues, the Fed is draining more and more resources from the future. It encourages people to borrow – by dangling near-zero interest rates in front of them.
This debt must be serviced and retired from future earnings. This reduces the amount of capital available for current wants and needs. Thus the future is placed in debt bondage to satisfy the desires of the here and now.
The whole world is in on it. With total global debt of $100 trillion, even if the world could set aside $5 trillion a year, it would take about 30 years to pay off the debt (including interest at “normal” rates).
But the world cannot set aside $5 trillion a year. It can’t even stumble along at break even. Instead, every year it needs an extra $5 trillion of borrowed money (net) just to stay at current levels of unemployment, asset prices, consumption and interest rates!
In other words, today, instead of paying down the past debt, we borrow more from the future just to stay in the same place.
 The question on the table the other day: How much future is left?
We didn’t have an answer. Today, we tackle an easier question: What will the future look like when it comes? We refer, of course, to that part of the future when the you-know-what hits the fan.
As we began to explain two days ago, the typical result of asset price inflation is asset price deflation. That much is guaranteed. And it could begin any day. US stocks were the main beneficiaries of the Fed-induced credit bubble. They will, most likely, be the main victims when the credit bubble bursts. Then the record highs of the recent past will be matched by record lows.
Nature loves symmetry. That’s just the way it is. What goes up must come down. Booms in margin debt, stock buybacks, junk bond issuance, and stock and bond prices will all be followed by terrible busts.
This is as it should be. It is natural. It is healthy. The junk is flushed out… the bad decisions and mistakes are cleansed… economic life can go on. A new boom can begin.
Of course, a real recovery would moderate the bust. Higher incomes, higher sales, higher profits – all contribute to the kind of growth that makes debt less of a burden.
Do we have a real recovery?
The official statistics tell us we have the weakest recovery since the Fed began instigating them. But a closer look at the figures tells us that there is no recovery at all.
Auto sales, house sales, household incomes – all are either flat or falling. You have heard, of course, that the unemployment level has fallen to 6.7%. You have also heard, we suppose, that much of the drop is attributed to older people who have simply retired.
But it isn’t true. Instead of retiring, old people have held onto their jobs like drowning men clutching to their life preservers.
The numbers tell the tale. The age group that has contributed most to the falling labor participation rate is the group in the prime earning years: 25 to 54. Workers over the age of 55, on the other hand, have actually increased their participation in the labor pool. They added 3% to the labor force; the younger group subtracted 4.7%.
Why would older people want to keep working? The obvious answer: They don’t have enough money to retire.
Young people, meanwhile, need to work. There is no question of retirement. But they can’t find jobs.
In other words, the data used to prove that the economy is well and truly recovering proves just the opposite. And here’s something else: The failure to bring a real recovery is the only thing allowing the bubble to continue expanding…
Regards,
Bill
Market Insight:
QE Risks Mount
From the desk of Chris Hunter, Editor-in-Chief, Bonner & Partners
The new head of the Bank of England, Mark Carney, has just stated the blindly obvious.
Speaking in front of an audience of bankers and financial academics in the City of London on Tuesday, Carney said, “It doesn’t take a genius” to see mounting risks to the financial system as a result of Global QE:
In pursuing price stability, monetary policy can contribute to the gradual build-up of financial vulnerabilities through its effect on the degree of risk-taking in the economy. For example, the period of low and predictable interest rates before the financial crisis helped drive a “search for yield” and leverage cycle, even with inflation subdued. It doesn’t take a genius to see that similar risks exist today.
For once, we find ourselves in full agreement with a central banker.
Carney’s message is simple: Artificially low interest rates led to a buildup of risk in the system that triggered the 2008 financial crisis. Artificially low interest rates that followed that crisis are leading to the buildup of new risks.
This will be of no big surprise to Diary readers. After all, what do central bankers think will happen when they erode free market signals… manipulate asset prices… trick people into investing behaviors that have adverse long-term effects (such as buying overpriced stocks and bonds)… and wipe out returns on retirees’ savings?
Bill has long cautioned against getting sucked into the kind of heavily distorted market we have today. As he says, what goes up must come down.
Make sure you’re not over invested in US stocks when the day of reckoning finally comes.

ZIRP Up Next?
Everyone expects Janet Yellen to be a rolling over, inflationist stooge just like they did Ben Bernanke. Bernanke came on board after Alan Greenspan had taken the Fed Funds rate up to around 5% if I remember correctly. Inflationists and gold bugs thought they had it in the bag when ‘Helicopter Ben’ assumed control.
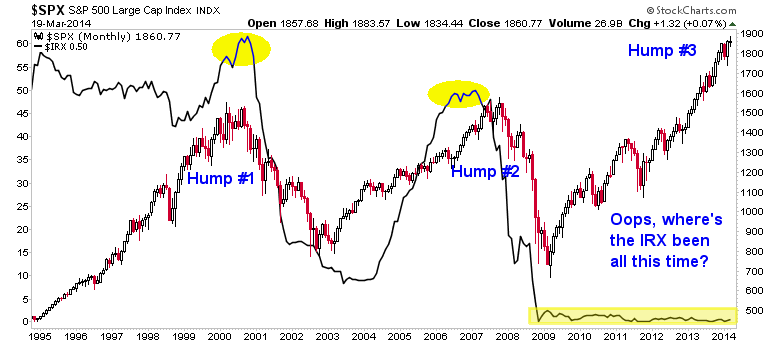
Indeed, Bernanke did what he was supposed to do (per the ‘Helicopter ‘Ben’ script) as systemic stresses began to gather in 2007, addressing that pesky Funds rate, culminating in December, 2008′s official ZIRP (zero interest rate policy). Here again is the chart showing the S&P 500′s ‘Hump #3′ attended by this most beneficial monetary policy.
As noted again and again, the much trumpeted ‘taper’ of QE is not only not a negative for the economy, we have made a strong casethat its mechanics are actually a positive, in the near term at least. But putting ZIRP on the table would be a whole different ball of wax.
We need to ask ourselves what kind of distortions the above chart represents, and what would be the implication of these distortions? The S&P 500 has, at the instigation of ZIRP formed a grand Hump #3 and yet this was done without the usual attendant rise in T Bill yields. In other words, the Fed has held ZIRP and continues to hold ZIRP, despite what Janet Yellen ruminated during her post-FOMC press conference:
How long after QE tapering ends will the Fed wait to raise the Funds Rate?
“So the language that we used in the statement is ‘considerable period.’ So I, you know, this is the kind of term it’s hard to define. But, you know, probably means something on the order of around six months, that type of thing.” –Janet Yellen
Nothing has changed, other than a new Fed Chief was asked a provocative question and she bumbled along with an answer. Sort of.
The key questions are…
What sort of inflationary pressures have been built into the system as a result of a fully formed Hump #3 having grown along side still-ZIRPed monetary policy?
and…
Does this have inflationary or deflationary implications?
The answer is for all the marbles where investment (that benefits from inflationary cost effects) or non-investment (cash) are concerned.
Again, as part of the above linked post, we have noted that an incentive is built in for banks to lend if ZIRP is maintained on the short end and the Fed tapers out of the QE bond buying business on the long end. Banks have indeed been lending. An end to ZIRP out in 2015, per Yellen’s answer above, starts a clock ticking on a constriction of this carry trade racket, theoretically at least. All she did after all was wrestle with the English language (“So I , you know, this is the kind of term it’s hard to define”) a little and give an answer (sort of).
But the 2009 to 2014 portion of the chart above is a distortion, no matter how you slice it. Normally, the S&P 500 runs positively with elevated or rising T Bill yields as it seems to test the will of policy makers every step of the way. This is the oldest contrarian play in the book; everybody fears rising interest rates, bears think it’s in the bag and yet the bull continues.
But this time the seed corn has already been used. I would argue that ZIRP should have been withdrawn long ago, let alone the vague “hard to define” timeline put out by the Fed Chief yesterday. The fact that ZIRP was not ended back in oh, 2010 or 2011, when inflation began to get out of control, was telling. What have they been afraid of? They say they want more ‘jobs’, less unemployment and more vibrant economic activity.
But you do not use something as powerful and potentially damaging as ZIRP for years on end unless there is something else going on.
This post has outgrown its original scope and so it will be concluded now.
Bottom Line
The conclusion is that it does not matter what Janet Yellen babbled yesterday, the market is going to balance the sheet sooner or later. That balancing will either come through accelerating inflationary pressures already seeded into the system as the Fed is compelled to raise interest rates or it will come in the form of a deflationary clearing of distortions as inflated asset prices come back in line. The problem is, using the T Bill rate as a proxy, that line has been crawling along the floor for 5+ years now.
Financial markets promise to be very interesting during Ms. Yellen’s first year at the helm. Let’s keep our preconceptions and biases under control and gauge what is actually happening every step of the way.
Biiwii.com | Notes From the Rabbit Hole | Free eLetter | Twitter
About Gary Tanashian
About Biiwii.com
Gary Tanashian of biiwii.com successfully owned and operated a progressive medical component manufacturing company for 21 years, keeping the company’s fundamentals in alignment with global economic realities through various economic cycles. The natural progression from this experience is an understanding of and appreciation for global macro-economics as it relates to individual markets and sectors.
Along the way, a geek-like interest in technical analysis, a long-time interest in human psychology and various unique macro market ratio indicators were added to the mix, with the result being a financial market newsletter (and dynamic interim updates), Notes From the Rabbit Hole (NFTRH) that combines these attributes to provide a service that is engaged and successful in all market environments by employing risk management first, and opportunity for speculation second.
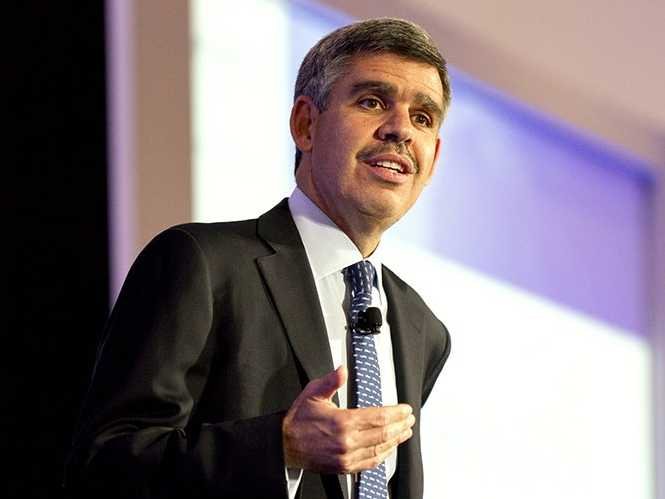 Mohamed El-Erian Explains:
Here are a few pointers as we all get ready for another highly-anticipated meeting of the FOMC, the Fed’s most important policy making committee.
The institutional context: This week’s FOMC meeting is of interest for more than its update of economic developments and prospects, policy insights and actions, and the periodic release of the summary of economic projections. It is the first FOMC meeting to be chaired by the highly-respected Janet Yellen; and it will be her first press conference as the leader of the most powerful central bank in the world.
The Policy Context: Absent some major economic acceleration or deceleration – and, I stress, it has to be major, one way or the other – the FOMC is essentially on automatic pilot for 2014. Specifically, the Fed will:
- Leave policy rates as is;
- Continue to taper in a gradual fashion with a view to fully exiting QE3 by the end of the year; and
- Evolve and strengthen its forward policy guidance.
The Economic Context: The FOMC’s approach is underpinned by the view that the underlying economic conditions are strengthening, albeit slowly; that balance sheets continue to heal; and that inflation is well contained (maybe too low). As such, senior Fed officials would attribute most of the recent weakness in economic indicators to the temporary and reversible impact of the weather. And the situation in the Ukraine would be seen as important to monitor but not a reason for a policy course adjustment.
The Intrigue: As it pivots from balance sheet purchases (QE) to greater reliance on forward policy guidance to support the economy, there are significant uncertainties as to how the Fed can/should best do this – particularly when it comes to the forward guidance component. What we know for sure is that the Fed will transition away from its current (narrow) unemployment threshold to a more holistic view of the labor market. This could even happen as early as this week. We don’t know as yet when our central bankers will supplement this by an inflation indicator that is well above the current rate. This is relevant for markets as investors would take the latter as an even stronger signal that the Fed would remain on hold for quite a while. If not, markets would be much more willing to test the central bank.
The Immediate Market Implications: Assuming other things are relatively constant (and that is a big assumption given what is happening in Ukraine and some other emerging economies), risk assets would do well if the Fed does indeed decide to evolve its forward policy guidance by moving both on the unemployment and on the inflation fronts – that is to say, inserting more comprehensive employment indicators and some type of inflation target. Also, in such circumstances, the dollar would weaken against other major currencies, inflation-protected bonds would do well, and the nominal Treasury yield curve would steepen.
The Big and Consequential Uncertainty: Notwithstanding the Fed’s continued activism and vigilance, and despite its deep and steadfast commitment to support growth and jobs, there are unanswered questions about the overall effectiveness of its current policy stance. The concern – for both Main Street and Wall Street – is that the longer the Fed experiments and the longer the economy fails to attain “escape velocity,” the greater the likelihood that the durable benefits of its unconventional policies would be offset by the “costs and risks.” Look for this issue to assume greater prominence as the Fed shifts this year from directly impacting the net supply of securities (via its QE purchases) to indirectly influencing it (via strengthened forward policy guidance). In the process, markets would likely periodically test both the Fed’s resolve and its effectiveness.
So far, investors have repeatedly given the Fed the benefit of the doubt. And it has been the correct trade, over and over again. But if the economy continues to respond rather sluggishly, and with developments in the rest of the world now acting as headwinds, the Fed may have to experiment even more to sustain the wedge between market values and underlying fundamentals.
Mohamed A. El-Erian is the former CEO/co-CIO of PIMCO. He is Chief Economic Advisor at Allianz and member of its International Executive Committee, Chair of President Obama’s Global Development Council and author of the NYT/WSJ bestseller “When Markets Collide.”
Check out Business Insider’s – 10 Things You Need To Know This Morning

With continued chaos and uncertainty in global markets, today KWN is publishing another incredibly important piece that was written by a 60-year market veteran. The Godfather of newsletter writers, Richard Russell, warns that “gold is being outrageously manipulated,” as the Fed prepares to stun the world by opening up “the floodgates of liquidity” for “QE5.” He also discussed Putin, stocks, the Great Recession, and China.
Russell: “Success in investing includes a number of nonspecific items. Patience, avoidance of greed, desire for peace of mind, avoiding huge losses, experience and judgment. From the low of 2009, the major Averages have more than doubled, and have moved into overvalued territory in terms of book value, price to earnings and dividend yield.
….read more HERE

Summary
- Last week saw mostly positive economic data but a negative market reaction.
- This week will start with Ukraine, but switch to a focus on the Fed.
- The range of expectations for the FOMC is wide, but a major change is unlikely.
- Investors can benefit from a solid plan for the week.
Rightly or wrongly, markets continue the Fed fixation. Many expect (or demand?) a change in Fed policy. This week marks the first FOMC meeting with Janet Yellen as the Chair. Since there will also be an update to forecasts, the announcement will include a press conference. With some fresh data and plenty of news since the last meeting, my theme for this week:
Fed Chair Yellen will take center stage.
Last Week’s Theme Recap
I expected last week’s theme (in the absence of much real data) to be focused on a parade of pontificating pundits. That was very accurate. As predicted, there were many articles of the laundry list type. That is where the pundit or journalist starts with a scary theme that can be expected to be popular and then looks back to find some similarities with the past. What a joke! Suppose you had a group of summer interns. Ask them to take any year in history and read newspapers, listing anything that is similar to current times. They will deliver.
Most people have a low bar for research findings, particularly when it suits their own conclusions.
This is a perfect illustration of the reason for my weekly post – planning for the week ahead. Readers are invited to play along with the “theme forecast.” I spend a lot of time on it each week. It helps to prepare your game plan for the week ahead, and it is not as easy as you might think.
This Week’s Theme
How should we get ready for this week’s Fed announcement? There are three basic positions:
- Rate hikes might come faster than expected. This is for one of two main reasons:
- Lower labor force participation (Matthew Boesler at BI).
- Lower growth potential (Morgan Stanley’s Vince Reinhart via Joe Weisenthal).
- There is plenty of labor slack from cyclical forces, suggesting the need for patience. Fed expert par excellence Tim Duy explains in a thoughtful articlewith many charts. It defies summary, so those who want to understand need to read it.
- Status quo. See Chicago Fed President Charles Evans. (Via Reuters).
We will probably start the week with breaking news from Ukraine, but by Wednesday our focus will, once again, be on the Fed.
I have some thoughts that I will share in the conclusion. First, let us do our regular update of the last week’s news and data. Readers, especially those new to this series, will benefit from reading the background information.
Last Week’s Data
Each week I break down events into good and bad. Often there is “ugly” and on rare occasion something really good. My working definition of “good” has two components:
- The news is market-friendly. Our personal policy preferences are not relevant for this test. And especially – no politics.
- It is better than expectations.
The Good
In a light week for data, there was some good news.
- Earnings growth remains solid – both reported and forecast. The last quarter of 2013 approached the 10% growth predicted by Brian Gilmartin and few others. In Brian’s most recent update he highlights the three time frames you should use when thinking about earnings growth:
- The quarter being reported, i.e. q4 ’13, is very robust. Hard to argue with +9.8% y/y earnings growth;
- The quarter within which we currently reside, which starts getting reported early April ’14. Current consensus estimate of +2%, will likely decline over the next 3 weeks, and then by mid-May, once the majority of companies report, we will likely end up between 4% – 5%, maybe better;
- Full-year ’14, which like q1 ’14 has been impacted by weather. I think the 2nd half of ’14 will be stronger than the first half of ’14.
- Retail sales beat expectations with a gain of 0.3% and 1.5% YoY. The monthly result was less impressive when considering revisions to the prior months. Calculated Risk notes that the YoY gain is 2.2% if you exclude gasoline sales. Doug Short has a great chart package. This one shows why the most recent update is (perhaps) not so exciting:

- The number of US millionaires is at a new high – 9.63 million versus 9.2 million in 2007. (LA Times).
- Initial jobless claims hit a new low – 315,000. It is a noisy series, but this is encouraging.
- Job turnover data remains positive. It was in line with expectations, butas Calculated Risk notes, it confirms a positive trend. The two things to watch are job openings and the quit rate (higher quits are very positive). You can see both from this chart:

The Bad
There was also some bad news.
- High frequency indicators continue to be weaker. I always read carefully the fine weekly summary from New Deal Democrat. He collects many concurrent indicators that each might seem minor, but collectively are quite significant. He documents a continuing overall soft patch.
- Copper prices are in a dramatic decline. The market seems to be reacting to this news. Some even infer a global recession from the recent message from “Dr. Copper.” The current pricing is heavily influenced by China – important, but not necessarily the only global factor. Dr. Ed prefers the CRB to copper, and discusses other factors as well. Here is the Yardeni chart:

- More Americans see Russia as a threat – 69% according to a CNN poll. 40% also fear a nuclear war with Russia. (If you share this fear, how should you invest? Answer in the conclusion.)
- Michigan sentiment disappointed. I regard this as an important indicator for both employment and consumption. It is time for a fresh look at my favorite chart of this data series, one that combines the history, GDP, recessions, and the average level. Naturally, it is from Doug Short.

- Ukraine developments. Regardless of one’s interpretation of events, the market will definitely interpret added tensions as negative. Stories about troop movements to the Crimean border will definitely rile the markets. As has been the case for the last two weeks, anything I write can be obsolete by the time you read it. Separate your interest as a citizen from your decisions as an investor. I have heard several stories about people who sold all of their stocks because of these events. In addition to the excellent sources I have provided over the last two weeks, I recommend this articleby William A. Watts of MarketWatch. It emphasizes the investment perspective. I love the comment from my friend and colleague Scott Rothbort, who writes a daily “Gut Feeling” column on the markets: This is a game of chess, not battleship.
The Ugly
9/11 planner released in a prisoner swap – now moved to Germany where the statute of limitations on terrorism is ten years. (Full story at The XX Committee).
Humor
We all deserve some laughs. Some of the most popular blog posts provide the humor that lends perspective to what is happening.
Bespoke’s premium service analyzed the over-reaction to small market moves (via Dorsey Wright).

And Josh Brown’s list of “explanations” for Thursday’s selling was a big hit. Check out his full list, but here are my favorites:
Fox Business: Obamacare
CNBC: It didn’t sell off at all, it was actually a reverse rally
Forbes: Taxes are too high
Huffington Post: Taxes are too low
Fox News: Gay marriage
Motley Fool: Sign up here to find out!
Bloomberg TV: The opposite of whatever CNBC said.
StockTwits: Here’s a chart
USA Today: Let’s take a poll
Zero Hedge: Better question, why would it have gone up?
Business Insider: Ten reasons, actually (view as single page?)
Financial Times: Please take a moment to register and accept cookies
MarketWatch: 1929
If you are a regular reader of these sources, you will be laughing.
Quant Corner
Whether a trader or an investor, you need to understand risk. I monitor many quantitative reports and highlight the best methods in this weekly update. For more information on each source, check here.

Recent Expert Commentary on Recession Odds and Market Trends
Georg Vrba: Updates his newest recession indicator, maintaining an increase in the “weeks to recession” from 26 to 27. This does not mean that there will be a recession in 27 weeks. Instead, it shows that the chance is “statistically remote” that a recession would start during that time. Georg’s BCI index also shows no recession in sight. For those interested in gold, Georg also sees a possible buy signal next month. Stay tuned!
RecessionAlert: Sees improvement in leading indicators for US growth, while highlighting danger areas worth monitoring. See the article for detailed charts on each indicator.
Doug Short: An update of the regular ECRI analysis with a good history, commentary, detailed analysis and charts. If you are still listening to the ECRI, you should be reading this update.
Bob Dieli does a monthly update (subscription required) after the employment report and also a monthly overview analysis. He follows many concurrent indicators to supplement our featured “C Score.” One of his conclusions is whether a month is “recession eligible.” None so far – and Bob has been far more accurate than the high-profile punditry.
David Rosenberg’s indicators suggest no recession and probably two more years of growth. His analysis will sound familiar to our regular readers, since it has been our message for almost three years:
For Rosenberg, the central question is whether the U.S. economy will relapse into a recession. Once you answer that question, he said, you can debate the direction of the equity and fixed-income markets.
The U.S. economy is incredibly resilient, he said, and he agreed with the adage that a recovery never “dies of old age.” It takes a “negative shock” to start a recession, he said – “and those always have the Fed’s thumbprint on them.”
A severe foreign-based shock is unlikely to derail U.S. growth, he said. Rosenberg noted that our economy and markets had good performance following the Asian crisis in 1997.
The Week Ahead
After a week of light data, this week is more normal.
The “A List” includes the following:
- Initial jobless claims (Th). Best concurrent read on the most important subject. Confirmation for new lows?
- Housing starts and building permits (T). Housing could be an economic driver. These are leading indicators.
- Industrial production (M). February data for a key GDP component.
The “B List” includes:
- Existing home sales (Th). Less important than new construction, but still a good measure.
- Leading indicators (Th). Still widely followed.
- CPI. With no signs of inflation, this remains a secondary indicator.
- Fed stress test results (Th – after the close). Some background here.
The FOMC announcement on Wednesday followed by Yellen’s first press conference will be the big event for the week. I am less interested in the regional Fed results.
How to Use the Weekly Data Updates
In the WTWA series I try to share what I am thinking as I prepare for the coming week. I write each post as if I were speaking directly to one of my clients. Each client is different, so I have five different programs ranging from very conservative bond ladders to very aggressive trading programs. It is not a “one size fits all” approach.
To get the maximum benefit from my updates you need to have a self-assessment of your objectives. Are you most interested in preserving wealth? Or like most of us, do you still need to create wealth? How much risk is right for your temperament and circumstances?
My weekly insights often suggest a different course of action depending upon your objectives and time frames. They also accurately describe what I am doing in the programs I manage.
Insight for Traders
Three weeks ago Felix made a dramatic switch from neutral to bullish adding trading positions throughout the week. That has worked pretty well. We remain fully invested. Many sectors have returned to the penalty box, reflecting reduced overall confidence in the three-week forecast.
It has been tougher than ever for traders, and that is saying a lot. This Taiwan Stock Exchange study says that “Less than 1% of the day trader population is able to predictably and reliably earn positive abnormal returns net of fees.”
Insight for Investors
I review the themes here each week and refresh when needed. For investors, as we would expect, the key ideas may stay on the list longer than the updates for traders. The current “actionable investment advice” is summarized here.
This is still an important time for long-term investors. We all know that market corrections of 15% or so occur regularly without any special provocation. Recent years have been the exception. Over the last several weeks I have emphasized the need to maintain perspective, using market declines to add to positions.
It helps if you have been actively rebalancing your portfolio and trimming winners. Then you have some cash. Some readers have asked me to write more on this topic, so I have placed it on the agenda. For now, let me do a quick summary.
- Review your holdings regularly. (For me, that means at least weekly, but it is my job. Quarterly is probably enough for most people, perhaps with some price alerts). Make sure that your original reasons for the investment are still valid. Revise your fair value and price target estimates.
- Do not fall in love with a position. If hanging on to a disappointing holding, make sure your reasons are sound.
- Sell if your price target is hit.
- Rebalance by trimming if a stock appreciates massively, but remains below the price target.
Each week I highlight some of the best advice I see. Here are some highlights.
Eddy Elfenbein has a typically level-headed analysis about what long-term investors can expect from stocks: 5% in real terms, half from capital appreciation and half from dividends. If you expect some inflation, you need to add that. Stocks are a good inflation-fighter. Read the full post for comparisons with some recent bearish arguments. If you are a good picker of stocks, you might add a little to that.
Value Line’s famous strategist, Sam Eisentadt, sees another 12% in stocks before September. No guarantees of course, but he asks if anyone has a method with a better track record for six-month changes. (Via Mark Hulbert).
Barry Ritholtz addresses the issue: How Market Tops Get Made
This is a good analysis of key factors developed over decades of research, so read about each. Here is a key quote:
What does all this mean for the current run? According to Lowry’s, “the weight of evidence continues to suggest a healthy primary uptrend with no end in sight.” For those concerned with a market top, that is rather bullish.
A few caveats about Desmond’s studies: Although he is rigorous and empirically driven, these data points all come from past market behavior. There are no guarantees that in the future, markets — that means you, Humans — will continue to operate the same way. Perhaps the changing structure of markets might impact market internals. Maybe the rise of ETFs will have an impact. Regardless, there are no guarantees the bull will continue.
However, based on the data Desmond follows, he makes a fairly convincing case that this bull market still has a ways to go before it tops out.
Steven Russolillo of the WSJ takes on the same topic with a checklist from Strategas Research Partners:

Why choose these sources to highlight? Integrity. Using indicators that have worked for years. This is in sharp contrast to those who start with a viewpoint and switch whenever the indicator no longer works. In a continuing exercise in futility, I wrote about this topic last week here and here. Most people would prefer to be scared witless (TM OldProf). Which leads to…
And finally, most Americans have missed the rally – so far – according to Bloomberg. If that describes you, you have company. This is one of the problems where we can help. It is possible to get reasonable returns while controlling risk. Check out our recent recommendations in our new investor resource page – a starting point for the long-term investor. (Comments and suggestions welcome. I am trying to be helpful and I love and use feedback).
Final Thought
I am well aware of the difference between perceptions and reality. The former is of greater interest to traders. Many of them have been caught off base (switching metaphors for the new season) and blame the Fed for their own mistakes. (See Fed as a Fig Leaf).
The reality is that the current QE rendition is having only a small economic effect and it will matter little when it goes. (See my QE summary.)
One of my regular themes is the over-emphasis on the Fed rather than economic fundamentals – earnings, recession risk, and potential financial stress. That focus will pay off for long-term investors.
Quiz Answer
Too easy, perhaps, but the answer comes from Art Cashin. He was a trainee during the Cuban Missile Crisis (1962). I remember reading the story nearly thirty years ago – and it was old then!! (See Paul Vigna). You might as well buy, since if they don’t find a solution, it won’t matter!

-
I know Mike is a very solid investor and respect his opinions very much. So if he says pay attention to this or that - I will.
~ Dale G.
-
I've started managing my own investments so view Michael's site as a one-stop shop from which to get information and perspectives.
~ Dave E.
-
Michael offers easy reading, honest, common sense information that anyone can use in a practical manner.
~ der_al.
-
A sane voice in a scrambled investment world.
~ Ed R.
Inside Edge Pro Contributors

Greg Weldon

Josef Schachter

Tyler Bollhorn

Ryan Irvine

Paul Beattie

Martin Straith

Patrick Ceresna

Mark Leibovit

James Thorne

Victor Adair