
Bonds & Interest Rates
Washington (AFP) – US producer prices slipped slightly in September after August’s gains, pulled down by falling food prices, leaving wholesale inflation almost flat from a year ago, the Labor Department said Tuesday.
Producer prices dropped 0.1 percent from August; excluding volatile food and energy, prices were up 0.1 percent.
For the year to September, producer prices — an indicator of inflationary pressures — were up a bare 0.3 percent.
That was the lowest 12-month change since October 2009, when prices were contracting, providing evidence that economic growth remains tepid.
“Despite noise in components, wholesale inflation is tame,” said economist Chris Low at FTN Financial.

Retail sales in the U.S. outside of auto dealers climbed in September, indicating households were sustaining the economic expansion before the government shutdown shook confidence.
The 0.4 percent gain in purchases excluding vehicles followed a 0.1 percent increase in August and matched the median forecast of economists surveyed by Bloomberg, Commerce Department figures showed today in Washington. Total sales dropped 0.1 percent, restrained by the biggest decrease at auto dealers since October 2012, as purchases early in the month were included in the August data.
Americans snapped up the newest cellular phones and video games last month as low borrowing costs and rising household wealth backed by improving home and stock prices gave them the wherewithal to sustain demand. At the same time, the 16-day partial closing of federal agencies may have upended spending this month as consumers grew increasingly concerned it would hurt the world’s largest economy.
“Consumers continue to hold in despite all the uncertainty going into the shutdown,” said Millan Mulraine, director of U.S. rates research at TD Securities USA LLC in New York, who accurately projected the gain in sales excluding autos. “We ended the quarter on a fairly solid note. Whether this buoyancy can be sustained remains a question after the hit to consumer confidence from the shutdown.”

The Conference Board has just released its monthly consumer confidence measure, and it was a big miss.
The measure dropped to 71.2 in October, down from 79.7 and missing economist expectations of 75.0.
“Consumer confidence deteriorated considerably as the federal government shutdown and debt-ceiling crisis took a particularly large toll on consumers’ expectations,” Conference Board Director Lynn Franco said in a statement.
“Similar declines in confidence were experienced during the payroll tax hike earlier this year, the fiscal cliff discussions in late 2012, and the government shutdown in 1995/1996. However, given the temporary nature of the current resolution, confidence is likely to remain volatile for the next several months.”
Respondents expecting business conditions to improve over the next six months dropped to 16% from 20.6%, but those expecting conditions to worsen jumped to 17.5% from 10.3%, according to the report.
- There are numerous measurements of the supply of money, and the Federal Reserve Bank of St. Louis has charts for most of them.
- These charts should be of particular interest to gold price enthusiasts, because they can indicate whether deflation or inflation is the major theme in play.
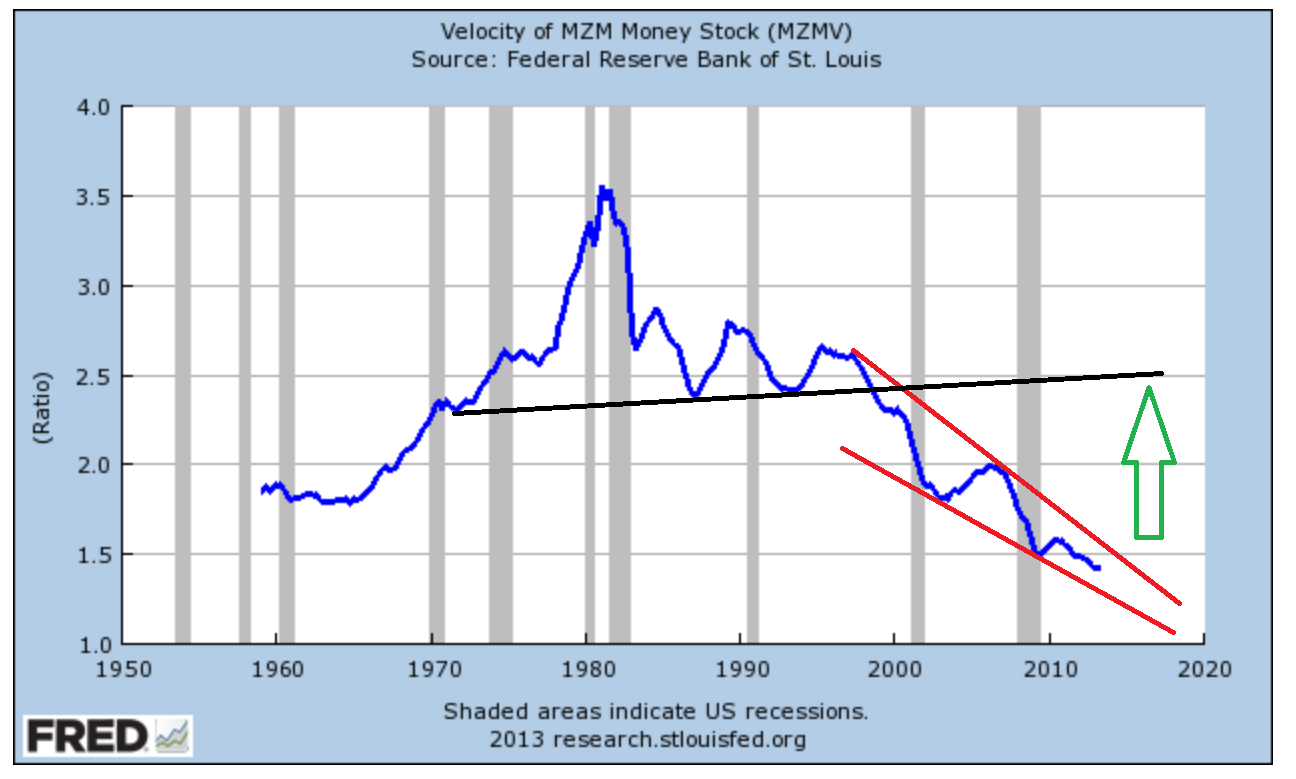 This “MZM” (Money Zero Maturity) chart is especially interesting, because it excludes large time deposits.
- MZM is a comprehensive money supply measure designed to represent money that is immediately available for spending by consumers, and it has been declining since gold peaked in 1980.
- Please note the red bullish wedge pattern that I’ve highlighted. I believe it is hinting that three decades of “deflationary rule” may be coming to an end.
- Even with that wedge in place, it’s likely going to take some time for the transition from deflation to inflation to occur, mainly because so mainly OTC derivative contracts were marked to “model” during the 2008 – 2009 economic collapse.
- It’s almost impossible for regular investors to get much accurate information about the quantity of OTC derivatives debt that still exists, and how much has been marked to market, by the Fed and the large commercial banks.
- In the meantime, it’s very important for gold investors to focus on key intermediate term highs on the gold chart. Gold may or may not have bottomed in the $1180 area, but until it rises above some of these highs, there is no real uptrend in play.
- The late August highs in the $1430 area must be exceeded before the current price action can be called a real uptrend.
- Please click here now. You are viewing the daily gold chart. Note the fan lines marked F1, F2, and F3.
- If gold can get above the F3 line, it has a chance of rallying to challenge the key $1430 area highs, and defining the price action as an uptrend.
- In terms of short term tactics, I’ve recommended that investors carry a seller’s mindset in the $1350 area, and a buyer’s mindset at $1266.
- Round number fans should now focus on placing buy orders in the $1300 price zone. The $1375 – $1400 area is where sell orders could be placed.
- For another view of the daily gold chart, please click here now. A lot of technicians have tried to call “the bottom” for gold, and some of them believe an “inverse head and shoulders” pattern has formed on the chart, which should produce much higher gold prices fairly soon.
- Unfortunately, I don’t think that pattern exists anymore, and if it does, it’s very weak. Instead, what I see on the gold chart is a gigantic symmetrical triangle. These patterns typically consolidate the existing intermediate trend, which in this case is down.
- Having said that, charts are created by fundamental events, and tensions between Israel and Iran are increasing again.
- I have a very hard time envisioning gold falling very much, given the fundamental backdrop of the Indian Diwali festival and this surge in Mid-East tension.
- My stokeillator (14,7,7 Stochastics series) is in “nosebleed” territory, but I use this indicator to predict trends that last for only very short periods of time (1 – 4 weeks).
- Any sell-off in gold in the short term should be quite mild. If the symmetrical triangle turns out to be a reversal formation, rather than a consolidation, the upside target is about $1680. That is a number that should put a serious smile on the faces of most gold investors!
- Some analysts wonder if falling energy prices could cause gold prices to begin a fresh decline. Oil prices have softened over the past couple of weeks, but there is substantial support in the current price area.
- Please click here now. That’s the daily oil chart. There is a head and shoulders top pattern in play, but there’s a larger symmetrical triangle that should lift prices higher. Also, many large oil market players are probably reluctant to short oil now, because of the important Iran-Israel dispute.
- As long as quantitative easing is in place, higher T-bond prices are likely to produce higher gold prices, and the long term T-bond chart is currently flashing many technical buy signals.
- Please click here now. Double-click to enlarge. This monthly chart shows that T-bond prices have touched the lower Keltner band, and many oscillators are exhibiting crossover buy signals. Even if there is a very short term sell-off, I think T-bonds are set to drive gold prices higher. I believe there will be an upside breakout from the large symmetrical triangle pattern that I showed you on the gold chart. The T-bond chart is bullish enough to suggest that rather than tapering QE, the Fed may soon increase it.
- What effect would increased QE and a higher gold price have on gold stocks? For the answer, please click here now. That’s the weekly GDX chart, and it looks spectacular. Note the “game changing” volume and the bullish action of the RSI and Stochastics oscillators. There’s also a significant double bottom pattern in play, and the technical target is the $38 area!
Oct 29, 2013
Stewart Thomson
Graceland Updates
website: www.gracelandupdates.com
email for questions: stewart@gracelandupdates.com
email to request the free reports: freereports@gracelandupdates.com

 On the heels of some wild trading action this week, today the 42-year market veteran, who correctly predicted that the Fed would not taper, warned King World News that investors should now brace for “horrific consequences for the US & for the world.” Below is what Egon von Greyerz, who is founder of Matterhorn Asset Management out of Switzerland, had to say in this fascinating interview.
….read it all HERE

-
I know Mike is a very solid investor and respect his opinions very much. So if he says pay attention to this or that - I will.
~ Dale G.
-
I've started managing my own investments so view Michael's site as a one-stop shop from which to get information and perspectives.
~ Dave E.
-
Michael offers easy reading, honest, common sense information that anyone can use in a practical manner.
~ der_al.
-
A sane voice in a scrambled investment world.
~ Ed R.
Inside Edge Pro Contributors

Greg Weldon

Josef Schachter

Tyler Bollhorn

Ryan Irvine

Paul Beattie

Martin Straith

Patrick Ceresna

Mark Leibovit

James Thorne

Victor Adair