
Bonds & Interest Rates
 Citigroup’s Economic Surprise Index just hit its lowest level since August 2011. But this level of disappointment has ironically emboldened the Fed to step up its hawkish monetary rhetoric. The truth is that the hard economic data is grossly missing analyst estimates to the downside as the economy inexorably grinds towards recession. This anemic growth and inflation data should have been sufficient to stay the Fed’s hand for the rest of this year and cause it to forgo the unwinding of its balance sheet.
But that’s not what’s happening. Ms. Yellen and Co. are threatening at least one more rate hike and to start selling what will end up to be around $2 trillion worth of MBS and Treasuries before the end of the year–starting at $10 billion each month and slowly growing to a maximum of $60 billion per month.
But why is the Fed suddenly in such a rush to normalize interest rates and its balance sheet? Perhaps it is because Ms. Yellen wants to fire Trump before she hears his favorite mantra, “you’re fired,” when her term expires in early 2018. It isn’t a coincidence that these Keynesian liberals at the Fed started to ignore the weak data concurrently with the election of the new President.
A Q1 GDP print of just 1.4% has not dissuaded the FOMC from a hawkish stance. And a lack of evidence for a Q2 rebound in the data hasn’t done so either. April housing data was very weak: New home sales in the single family category were down 11.4%, existing home sales were also down 2.5%. And even though there was a small bounce back in housing data in May, Pending Home Sales have fallen three months in a row and were down 0.8% in May. Retail sales dropped, 0.3% and durable goods declined 1.1% during May; while the key metric for business productivity, core capital goods orders, fell 0.2%.
It’s not just economic growth indicators that are disappointing, but also evidence of disinflation abound everywhere. Measures of Consumer Price Inflation and the Personal Consumption Expenditure price indexes are falling further away from Fed’s 2% target. Commodity prices are also illustrating signs of deflation. The CRB Index is down 14% so far this year and WTI crude oil is in a bear market. Further evidence of deflation is seen in the fact that the spread between long and short-term Treasury Yields are contracting. There has been a six-month decline in C&I loan growth and the household survey within the Non-farm Payroll report turned negative in May. The Household Survey is a leading indicator for the Establishment Survey and the overall employment condition.
Wall Street’s currently favorite narrative is one of strong earnings growth. But according to FactSet, nearly half of Q2’s projected 6.5% EPS growth is from energy. Excluding this sector, EPS growth is projected to be just 3.6%. The projected average price of WTI crude for Q3 is $54.29. With the oil price now hovering around $43 per barrel, the hoped-for boost to EPS growth from energy will turn into a big drag unless crude turns around quickly.
The economy should continue to move further away from the Fed’s growth, and inflation targets as its previous monetary tightening starts to bite. But one last nail in the coffin for Fed hawks will be an NFP report sub 50K. The odds are very high that such a weak print on jobs will occur before the next hiking opportunity on Sept. 20th. In addition, if the S&P falls more than 15% from its high the turn in Fed policy from hawkish to dovish is virtually assured. From there it will turn to panic as the economy and stock market meltdown.
I say meltdown because, at 25x reported earnings, the S&P 500 is the 2nd most expensive in history. But this particular overvalued market exists in the context of a weak and slowing economy; coupled with a tightening monetary policy that has been in place since the Fed started to reduce the amount of its $85 billion per month worth of bond purchases back in Dec 2013. And, most importantly, the coming market crash and recession will occur with the balance sheets of the Treasury and Fed already extremely stretched. Hence, an extrication from this recession will not happen quickly or easily.
All of the above makes this the most dangerous market ever. This crash and ensuing economic downturn, which given history, logic and the data should happen soon; will alter the Fed’s current stance on monetary policy. But it will happen too late to preclude a very steep decline in GDP.
Therefore, if Mr. Trump cannot push through his tax cutting agenda rather quickly it may be both Ms. Yellen and the Republicans that find themselves moving out of D.C. in 2018; and move the Donald back to the Apprentice after just one term.
By Michael Pento

 A worsening shortfall in new credit
Global macro economic data has been weak for many years, but there’s now a very real chance of a world-wide recession happening in 2017.
Why? A dramatic and worsening shortfall in new credit creation.
The world’s major central banks have, again, done the world an enormous disservice. Instead of admitting that maybe/perhaps/possibly the practice of issuing debt at more than twice the rate of underlying economic growth was a very bad idea over the past several decades, they instead doubled down and created an even larger debt monster to be dealt with.
The resulting global asset price bubble — or, more accurately, set of nested and incestuously intertwined bubbles — can collectively be called the Mother Of All Bubbles (MOAB). None has ever been larger in history.
Let’s have a look at a long-term perspective on Treasury yields as of Friday’s close. The chart below shows the 10-Year Constant Maturity yield since 1962 along with the Federal Funds Rate (FFR) and inflation. The range has been astonishing. The stagflation that set in after the 1973 Oil Embargo was finally ended after Paul Volcker raised the FFR to 20.06%.
Last year was a remarkable one for yields. The 10-year note hit its historic closing low of 1.37% in July and then rose 123 BPs to its 2016 closing high of 2.60% in mid-December. The yield on the 10-year note to date has dropped to 2.16% as of Friday’s close.


The target for TLT continues to be around 129. Treasury bonds are in bull trends (remember back a few months ago to all the bond hatred in the media). How does an eventual decline in bonds square with what we just noted above regarding Q4 2008? [work done in the preceding Precious Metals segment] Treasury bonds were a wonderfully bullish asset during Armageddon ’08 and who’s to say that an upside blow off may not be coming sooner rather than later amid massively over bullish sentiment? I mean, there is certainly no stop sign at our 129 target. Sentiment, as we are all too aware, can take a long while to manifest in pricing.

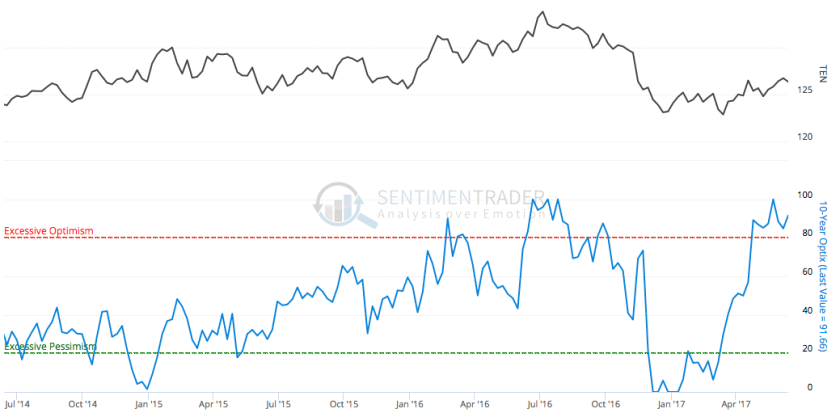
And that sentiment (and CoT) data are still pointing to a bearish bond future. Public optimism is still extremely over bullish on the 10yr bond.
Graphics courtesy of Sentimentrader…
Commercial hedging is still in a net short state, also bearish for the 10yr bond.

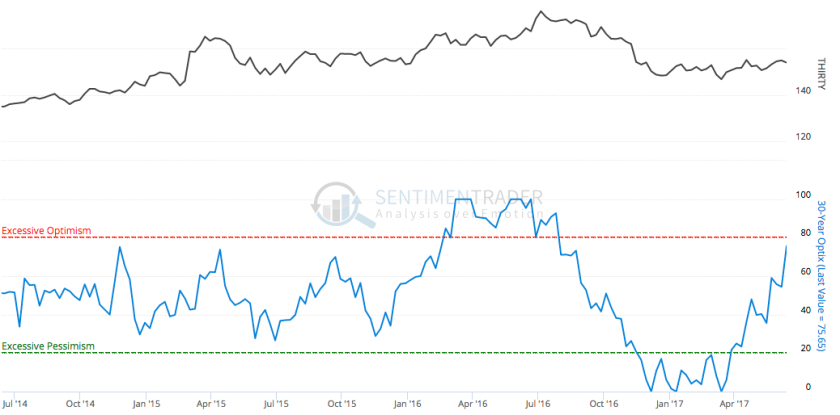
Now you will recall that the 30yr had been a holdout to the bear case as its Optimism and Commercial hedging data were only so-so, not too hot and not too cold. Well, public optimism is headed directly for the red line on the 30yr.
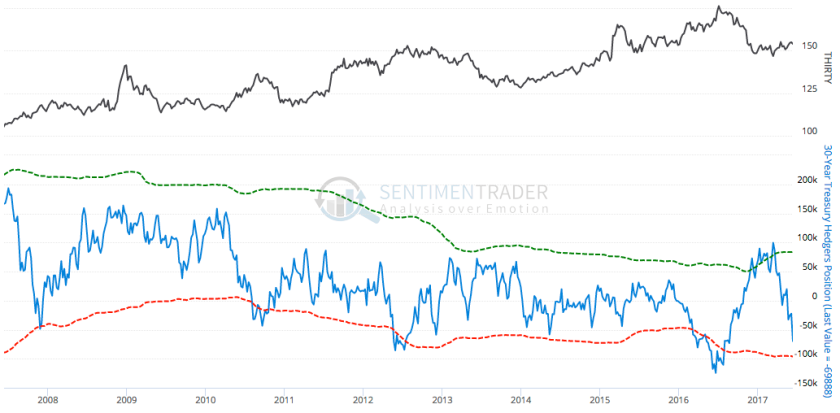
And Commercial hedgers are now net short the 30yr and driving it toward extreme territory.
Perhaps the 30yr will prove to have been a better timer when all is said and done. I don’t pretend to know the future, but am simply stating there is a scenario where the dynamics in Treasury bonds can also fit the scenario noted in the Precious Metals segment. If bonds blow off into a deflationary episode as they did in Q4 2008, what could come next is an inflationary episode, as it did in 2009. That would drive yields up.
Folks, my job is to illustrate rational scenarios and yours is to keep a grain of salt.
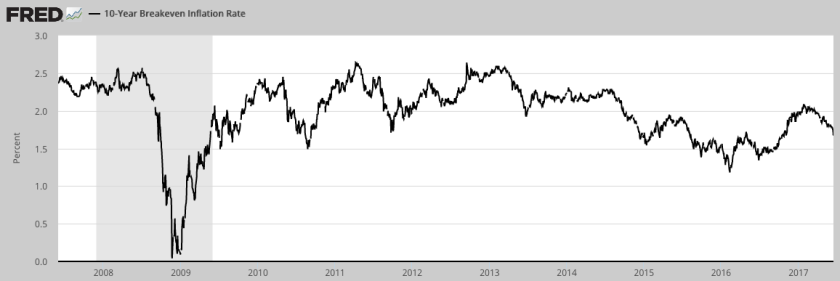
We have been using the TIP/IEF ratio as an ‘inflation expectations’ (IE) indicator. It has been declining for all of 2017 after rising in the Trump-fueled ‘fiscal reflation’ trade to end 2016. You can see how inflation expectations crashed in Q4 2008. To further the point made above we became bullish in that period, first on the precious metals, then on commodities (oil and copper, as I recall) and later, stocks. The gold sector bottomed in the depths of the IE crash and then commodities bottomed after the ‘V’ bottom in IE.
Graphics courtesy of the St. Louis Fed…
Finally, let’s end with a dissimilarity to Q4 2008. Economic dislocations did not start happening until this [10yr-2yr] spread started to turn up and when it did turn up it was from much lower levels (sub-zero) than today.
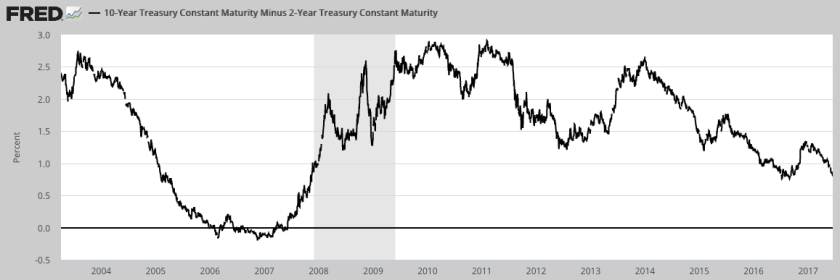
People who want to be bullish on stocks often talk about how the stock market is fine until the yield curve becomes inverted. In 2007, 10-2 went sub-zero and wallowed along down there well into 2007, before turning up. With that came the first signs of stress as Bear Sterns and Lehman Brothers started to blow up.
The question now is ‘who says the curve has to invert before the next up turn?’
Is that an etched in stone law of economics and finance? Given the stimulants injected into the system post-2008 I would not make a bet that all need be symmetrical and logical to history. Regardless, the bottom line is that if the curve starts to turn up we can be on alert for a negative liquidity event. Thus far, the curve remains in decline and all appears fine, for now. But if inflation expectations continue to tank… ?
NFTRH.com and Biiwii.com


Yes, traumatic market events (falling rocks) occur, even though markets are “managed,” statistics are manipulated, and politicians pretend to care about something besides their next election.
From John P. Hussman, Ph.D. Fair Value and Bubbles: 2017 Edition
“Unfortunately, investors seem to have concluded that central bank easing is omnipotent, despite the fact that the Fed eased persistently and aggressively, to no effect, through the entire course of 2000-2002 and 2007-2009 market collapses.”
From Bill Gross: Bill Gross Says Market Risk is Highest Since Pre-2008 Crisis
“Central bank policies for low-and-negative-interest rates are artificially driving up asset prices while creating little growth in the real economy and punishing individual savers, banks, and insurance companies, according to Gross.”
“I’m very concerned about where we are in terms of the financial system, the economy, the American economy, the Global economy… After nine years of this artificial levitation on the part of financial assets – high-end real estate, art, the things that rich people buy – I think what we have today is a global financial system that’s just about as leveraged, and in many case more leveraged than before 2008.”
“Madoff Whistleblower Harry Markopolos Has Uncovered a New Fraud”
“Markopolos called what is left of the MBTA’s pension (Boston Transit Authority) a ‘Tender Vittles retirement plan’ meaning (sarcastically) that its participants would be eating cat food.” Is this different, except in degree, from Illinois, Chicago, New Jersey, CalPers (California) and many other pension plans?
“No good outcomes result when you mix politics and money,” Markopolos said.
From Karl Denninger: Illinois is Collapsing: It’s Coming Everywhere
“It was obvious that Illinois was going to fail as a state before I left in 2000.”
Denninger, in my opinion, sees the past, present, and future more clearly than most people, including self-motivated politicians and Wall Street Bankers. He is worried about ever-increasing U.S. government expenditures, long term commitments, and national debt. He also warns about public and private pension plans, medical/sick care costs and more.
Speaking of bubbles and near-bubbles, consider the “Everything Bubble,” and the exceptional rallies in the NASDAQ 100 and Amazon stock. The current rallies are not as steep as during the 1999-2000 NASDAQ but the NASDAQ 100 and the “FAANG” (Facebook, Apple, Amazon, Netflix, Google) stocks have risen far too high.


What created the bubbles and near-bubbles? Central banks created $15 trillion from “thin air” and much of that “funny money” boosted stock prices. Japanese, Swiss and other central banks intentionally created currency and bought U.S. stocks, such as Amazon and Apple, which also promoted the NASDAQ levitation.
An excellent 20 minute video explains how central banks “create” currencies and expand the total digital debt and credit.

Crash – Correction?
The U.S. stock markets could have crashed in 2015, but did not. They could have crashed several times in 2016, but did not. They could have crashed in 2017, but are hitting all-time highs instead. The sizable rallies have been enabled by central bank purchases of stocks.
What happens if central banks cease purchases, or “heaven forbid,” those central banks sell aggressively? Could such sales create a “market event” to crush an economy or a sitting President or be used to enrich Wall Street?
The 1987, 2000, and 2008 market crashes hurt most people. Preparation, in case central banks don’t printenough currency to keep bubble-like markets inflated, is appropriate. Brilliant and wealthy people are concerned about the global financial system and the potential disasters created by excessive debt, central banks and politicians.
Hindenburg Omen: We Got an Official Confirmed Hindenburg Omen Stock Market Crash Warning Signal
Robert McHugh, Ph.D. says his revised Hindenburg Omen seldom occurs but when it does, pay attention. It is not a guarantee of a crash, but it is noteworthy!
Europe: Banco Popular failed in Spain. Italian banks are shaky. Are Deutsche Bank and Chinese wealth management Ponzi debts next?
Repeat:
“No good outcomes result when you mix politics and money,” Markopolos said.
I SUGGEST:

Gary Christenson
The Deviant Investor


-
I know Mike is a very solid investor and respect his opinions very much. So if he says pay attention to this or that - I will.
~ Dale G.
-
I've started managing my own investments so view Michael's site as a one-stop shop from which to get information and perspectives.
~ Dave E.
-
Michael offers easy reading, honest, common sense information that anyone can use in a practical manner.
~ der_al.
-
A sane voice in a scrambled investment world.
~ Ed R.
Inside Edge Pro Contributors

Greg Weldon

Josef Schachter

Tyler Bollhorn

Ryan Irvine

Paul Beattie

Martin Straith

Patrick Ceresna

Mark Leibovit

James Thorne

Victor Adair