
Bonds & Interest Rates
With the Fed having hiked thrice and calling for three more hikes still, the 2017 Hoisington First Quarter Review contains a call that will have many if not most analysts shaking their heads: “The secular low in bond yields remains in the future, not the past,” says Lacy Hunt.


During this 25+ minute interview, Marc is asked if he thinks the Federal Reserve will increase interest rates 2-3 times more in 2017? Marc thinks the Fed will only raise rates once more in 2017 before the next global financial crisis. He thinks the Federal Reserve will reverse course, start lowering interest rates again and do a large QE program.
Marc thinks global central bankers are routinely coordinating monetary and interest rate policy as well as exchange rates with each other to prevent a “colossal debt bubble” from bursting.
Jason and Marc also discuss whether the Fed can hurt Trump’s spending programs. Marc thinks Trump will need the Fed’s help to fund his spending programs.
Jason and Marc also discuss current stock market valuations compared to past stock market crashes, whether China will need to devalue the RMB another 20-30% like Kyle Bass predicts, whether bonds are now in a bear market, how people should be diversified, and how President Trump will pay for all of his spending programs.
…also: Marc Faber: Emerging Markets Outperforming The US Despite Trump Rally
There are plenty of things that can keep investors up at night worrying about what could derail the stock market. Rising interest rates should not be one of them.
I get a ton of mailbag questions these days asking whether the Fed will get too aggressive with hiking rates, eventually killing the eight-year bull market in stocks.
The implication is: When rates go up, stocks must go down.
Everyone’s heard this so often it’s accepted as truth. In fact, not a day goes by when I don’t overhear some talking head on CNBC touting this nonsense.
Don’t believe it, because it’s pure baloney.
Last week, I updated you about where we are right now in the big-picture cycle analysis that Larry Edelson pioneered and passed on to us as his legacy. As he correctly forewarned, all the major economic cycles point in unison: A supercycle convergence of historic proportions.
Besides his ardent study of cycles, Larry was also a keen student of history. And he constantly applied historical analysis to his market forecasts. Correctly identifying historical market patterns, sometimes long forgotten, but destined to repeat.
The upshot? During turbulent periods like this, markets could behave exactly the opposite of what you would expect. You simply can’t afford to rely on old myths about how the markets should behave.
The single biggest myth gaining traction right now is
about interest rates and stock prices.
Everyone seems to believe that when yields move up, stocks will tumble – but that’s total hogwash – nothing could be further from the truth.
Historically most bull markets in equities occur with rising interest rates, not falling rates. Conversely, most bear markets in stocks happen alongside declining interest rates. It is exactly the opposite of what you hear.
Just look at recent history: The Fed has raised interest rates three times since December 2015, and promises more to come, yet stocks are up nearly 15% since the first rate hike.
Want more proof? Let’s take a look at one of the greatest secular bull markets in history: The 1950s and ’60s! Take a look at the charts below and you’ll see what I mean.

The chart at left shows the Dow (top panel) and Treasury yields (bottom) from 1954 to 1962. Above right shows the Dow and yields from 1960 to 1965.
As you can clearly see, stocks and interest rates rose together, not always in lockstep to be sure, but the upward trend in both stocks and yields over the same period is unmistakable.
Treasury yields rose from less than 2.5% to more than 4% over this entire period. If that happened today, the doom-and-gloomers on CNBC would be pounding the table about an imminent stock market crash.
But historically, when this scenario actually played out in the ’50s and ’60s, the Dow soared 279%; stocks went up, up, and away, together with interest rates.
Bottom line: Don’t listen to myths in the financial media about higher rates hurting stocks, it’s simply untrue. Think for yourself, do your own homework, and if you analyze the markets from a historical perspective, you’ll see the hard evidence plain as day.
Interest rates are going up for many years to come, and that is the most bullish thing that can happen to stocks, not to mention commodities!
Good investing,
Mike Burnick

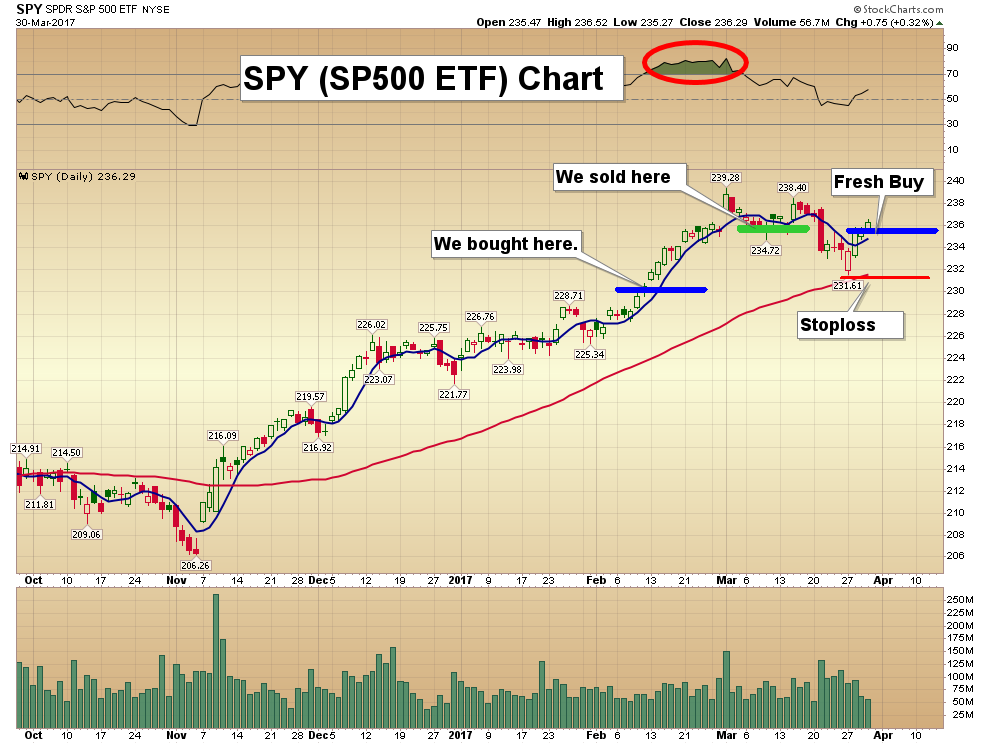
Here are today’s videos and charts (double click to enlarge):
Big Picture Key Charts & Video Analysis


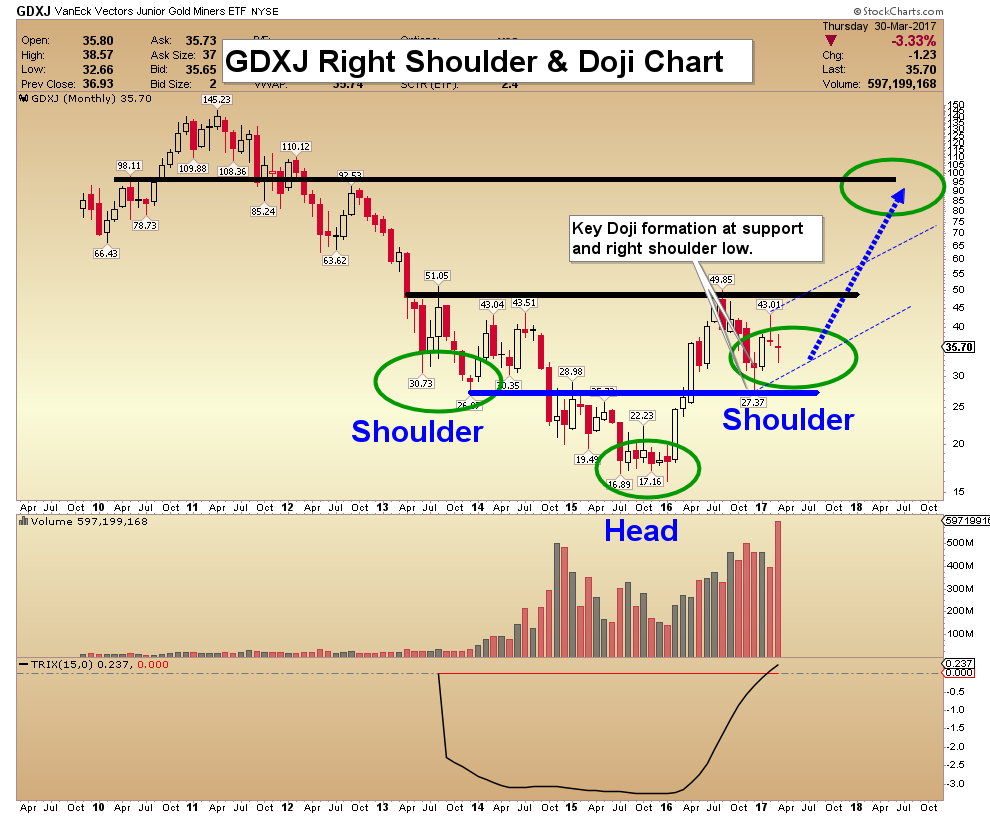
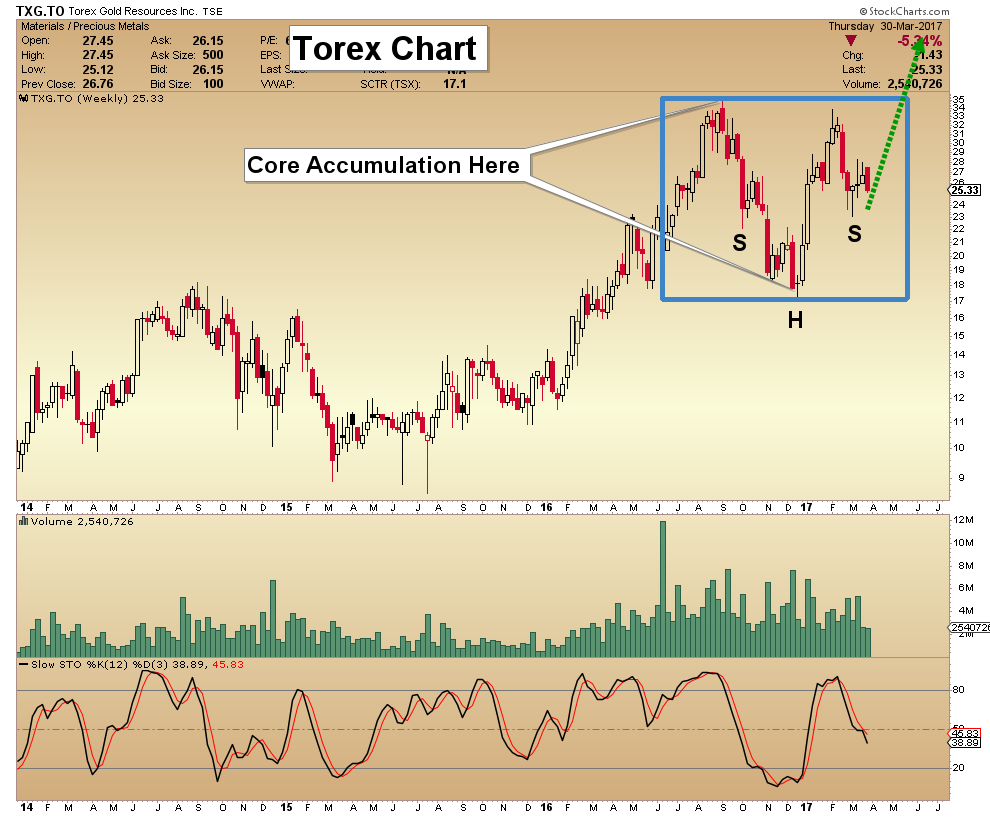
SF Juniors Key Charts & Video Analysis


SF60 Key Charts & Tactics Video Analysis


SF Trader Time Key Charts Video Analysis


Thanks,
Morris
The SuperForce Proprietary SURGE index SIGNALS:
25 Surge Index Buy or 25 Surge Index Sell: Solid Power.
50 Surge Index Buy or 50 Surge Index Sell: Stronger Power.
75 Surge Index Buy or 75 Surge Index Sell: Maximum Power.
100 Surge Index Buy or 100 Surge Index Sell: “Over The Top” Power.
Stay alert for our surge signals, sent by email to subscribers, for both the daily charts on Super Force Signals at www.superforcesignals.com and for the 60 minute charts at www.superforce60.com
About Super Force Signals:
Our Surge Index Signals are created thru our proprietary blend of the highest quality technical analysis and many years of successful business building. We are two business owners with excellent synergy. We understand risk and reward. Our subscribers are generally successfully business owners, people like yourself with speculative funds, looking for serious management of your risk and reward in the market.
Frank Johnson: Executive Editor, Macro Risk Manager.
Morris Hubbartt: Chief Market Analyst, Trading Risk Specialist.
website: www.superforcesignals.com
email: trading@superforcesignals.com
email: trading@superforce60.com
SFS Web Services
1170 Bay Street, Suite #143
Toronto, Ontario, M5S 2B4
Canada
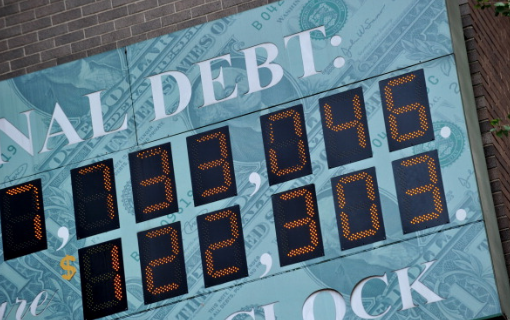 While Washington is buried in bungled health care reform and Wall Street is vexed about possibly jinxed tax reform, both seem to have lost sight of the one, giant, intractable monster in the economy that virtually no one talks about any more: Debt.
They seem to forget that excess debt was the repeat offender behind the bank failures of the 1980s, the subprime mortgage disaster of 2007, the global market meltdowns of 2008, the Great Recession of 2009 and the multiple European debt crises of 2008-2015.
Worse, they seem to ignore the fact that the last 7.5 years of near-zero interest rates and unbridled money printing have only encouraged still more debt pile-ups. “Money is dirt cheap, so why not?” say officials in Congress, the White House, the Treasury Department, and government agencies.
“As long as the government’s debt burden is under 100% of GDP,” they tell you, “we can handle it. It’s only when it surpasses the 100% threshold that we’ll be in danger.”
True or false? Let’s look at the numbers …
- U.S. GDP is $18.6 trillion. And …
- U.S. Treasury debts outstanding are $16 trillion.
- So that means the debts are under the 100% danger threshold, right?
Wrong! That calculation conveniently excludes government debts that have piled up on the books of U.S. government agencies and U.S. government-sponsored enterprises, such as the Federal Home Loan Banks, Federal National Mortgage Association (Fannie Mae), Federal Home Loan Mortgage Corporation (Freddie Mac), Farm Credit System (FHS) and others.
How much? According to the Federal Reserve’s Flow of Funds, as of year-end 2016, they have a massive $8.5 trillion of additional debts.
These agencies were created by the U.S. government, are controlled by the U.S. government, and during the last debt crisis, were the biggest failures to be bailed out by the U.S. government. After that experience, how anyone in their right mind could continue to exclude their debts from the U.S. government’s books is beyond me. And yet that’s precisely what Washington has been doing all along, whether under Clinton, Bush, Obama or Trump.
Add those debts to the government’s total burden … and guess what! Instead of $16 trillion in U.S. government debts outstanding, the actual total comes to $24.5 trillion, or a whopping 132% of GDP!

How bad is that? Even with the recent growth in the U.S. economy, the government debt load today is significantly larger than it was during the Great Recession and the Debt Crisis.
And from a longer term perspective, it’s absolutely horrendous. Compare it to the 1980s, when banks and S&L went under by the thousands. In those days, government debt (even including government agencies) was close 40% of GDP. Today it’s more than three times bigger.
Or compare it to year-end 1970, about eight months before President Richard Nixon devalued the dollar and abandoned the gold standard. Then, the U.S. government debt burden was only 32.9% of GDP. Now, at 132%, it’s over four times larger — in a nation that’s far more difficult to govern or reform than it was in the 1970s. Moreover …
At 132% of GDP, the U.S. government now has roughly the same debt troubles as Italy. Worse, it now has a larger debt burden than Greece had before its collapse of years ago.
And this doesn’t even begin to include the U.S. government’s obligations for Medicare, Social Security, veterans’ benefits and more.
Will these shocking realities hinder private corporations in their quest for bigger profits, prevent investors from piling into the stock market, or stop the Dow from continuing its upward rampage? Probably not yet.
Will it return to haunt the Fed, the U.S. Treasury, Congress and Mr. Trump? Probably sooner than later.
Which market will be the first to feel the impacts? Government bond markets, of course. Expect long-term bond prices to begin a secular decline, culminating in collapse, as their yields begin a long-term rise, culminating in an explosive surge.
Good luck and God bless!
Martin

-
I know Mike is a very solid investor and respect his opinions very much. So if he says pay attention to this or that - I will.
~ Dale G.
-
I've started managing my own investments so view Michael's site as a one-stop shop from which to get information and perspectives.
~ Dave E.
-
Michael offers easy reading, honest, common sense information that anyone can use in a practical manner.
~ der_al.
-
A sane voice in a scrambled investment world.
~ Ed R.
Inside Edge Pro Contributors

Greg Weldon

Josef Schachter

Tyler Bollhorn

Ryan Irvine

Paul Beattie

Martin Straith

Patrick Ceresna

Mark Leibovit

James Thorne

Victor Adair