
Bonds & Interest Rates
“Technically Speaking” is a regular Tuesday commentary updating current market trends and highlighting shorter-term investment strategies, risks, and potential opportunities.
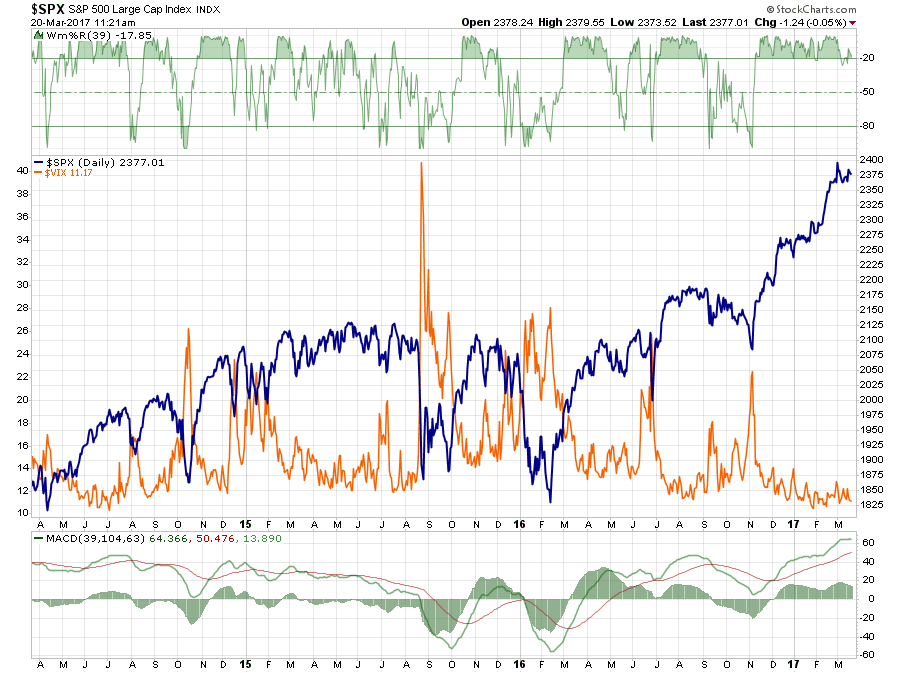
In last week’s post, I did a complete sector and major market review. Not much has changed in the past week given the very quiet activity that has persisted. This lack of volatility, while not unprecedented, is extremely long in duration as noted in past weekend’s newsletter, “An Unexpected Outcome:”
“Speaking of low volatility, the market has now gone 108-trading days without a drop of 1% for both the Dow and the S&P 500. This is the longest stretch since September of 1993 for the Dow and December of 1995 for the S&P 500.”
The issue becomes, of course, which way the market breaks when volatility returns to the market. Over the course of the last three years, in particular, those breaks have been to the downside as shown below.
…also, Michael’s Interview with Lance Roberts March 18th:


This proxy for T-Bonds has quietly slipped into no man’s land with the recent breach of December’s bombed-out lows near 116.80. Even before this occurred, TLT looked like a good bet to fall to at least 111.97, the midpoint Hidden Pivot support of the pattern shown. But it would require only a breach of the July 2015 low at 114.88 to do very serious damage to the long-term chart. If the 111.97 target is hit, it would correspond to a rise in long-term interest rates to about 3.37% from a current 3.19%. And if TLT were to fall all the way to the D target at 100.79, yields would be around 3.84%. For borrowers in the U.S. and around the world, this would be more than just a turn of the screw. Indeed, if stock prices were to fall simultaneously as seems logical, it would crush them beyond any hope of recovery. Meanwhile, any counter-stimulus equal to the problem would be tantamount to hyperinflation.
Click here for two weeks’ free access to Rick’s Picks

The popular financial press is making a big deal about the Fed’s almost-certain 25-basis-point hike in the discount rate that is set to occur at next week’s Federal Open Market Committee meeting. But don’t get lost in all the bluster and hoopla.
Why?
Because the Fed’s decision will have very little impact on your portfolio.
Since a picture is worth a thousand words, I am going to use four easy-to-follow charts to make my point.
To get a true picture of what’s going on, we first need to step back and take a macro view of what the Fed is up against. The chart below shows the history of Federal debt held by the public since the nation’s founding.

As you can see for yourself, when the financial crisis hit in 2008, federal debt exploded to its current level of $14 trillion. And get this — the $14 trillion doesn’t even count the federal agency debt supporting farm loans, home mortgages and a variety of other programs, which total another $5 trillion and puts the total official debt level at about $19 trillion.
And then when you throw in the government debt related to unfunded liabilities for federal social service programs, like Social Security and Medicare, the total debt skyrockets to an estimated $130 trillion. No matter how you slice it, total federal debt has become a BIG number.
To make matters worse, at the same time the U.S. government was levering up … so was corporate America. This chart from the Federal Reserve Bank of St. Louis shows that corporate debt in the U.S. has risen about 60% since the first quarter of 2009.

Next, let’s drill in and see what all this newly issued debt means to the Federal operating budget. The CBO has made projections on how the budget will evolve over time at current interest rates as shown below.

As this chart reports, interest expense is currently 6% of total expenditures — which amounts to a lot of dollars ($240 billion) — but is a relatively small piece of the federal budget pie. Now, look at how the interest on the debt is projected to grow over the next 30 years to a level where it absorbs 21% of the total budget, with no shrinkage in sight.
And that’s at current interest rate levels — imagine what happens if interest rates go up considerably! The equation just won’t work!
It’s the same for corporate America too: As interest rates go higher, interest expense goes up and there’s less money available for productive spending, which then results in slower private sector growth. Slower growth means lower interest rates. That’s why, as I’ve pointed out previously, it becomes an endless feedback loop where interest rates can only go up so much.
And Wall Street knows this too!
What’s my proof?
Well, here’s a chart that shows the yield on the benchmark 10–year U.S. Treasury over the past four years.

As you can see at its current level, the 10-year U.S. Treasury is within 12 measly basis points of where it started the year. Sure, the Fed can hike the short-term end of the curve. But investors around the world, including those on Wall Street, set the rate on the 10-year. And Wall Street is telling us that there’s no big increase that they see on the horizon.
This means — given current economic conditions — the Fed can only go so high on short-term rates without flattening the yield curve and causing a recession or without risking a stock market sell-off. But they can — and will — talk a lot about raising rates. That’s because it’s all part of the nine-step plan that the Trump administration and the Fed have for the U.S. economy that I outlined in last week’s Money and Market’s column.
What should investors do?
As I’ve written extensively about, the current environment favors stocks.
But — and pay attention because this is a big BUT …
One of the biggest myths on Wall Street is that activity is often correlated with results … meaning the more activity there is in a portfolio, the better the results. But that’s just not true.
The best investors on the planet follow this rule: What you don’t do is just as important as what you do.
So following this golden principle, in this environment, what you don’t do is go out and load up on a bunch of expensive stocks. On the other hand, and just as importantly, what you don’t do is run out and short a whole host of stocks that look to be overpriced either.
As world-renowned investor Jim Rogers would say: “Now and then a time comes when doing nothing and waiting is the wisest course of action.”
That’s why, as the editor of the Safe Money Report, I’m following Jim’s advice for now and suggest that you do the same.
Best wishes,
Bill Hall

With seemingly everyone from the blogosphere to the Tweeter-in-chief chiming in on fake news, have investors considered their risk/return profile may also be “fake”? When it comes to investing, who or what can we trust, is the market rigged, and why does it matter?

For eight years in a row now, an investment in the S&P 500 has yielded positive returns.1 In recent years, expressions like “investors buy the dips” and “low volatility” have become associated with this rally.
In the “old days”, investors used to construct portfolios that, at least in theory, provided a risk/return profile that they were comfortable with. For better or worse, I allege those “old days” are over. To be prepared for what’s ahead, let’s debunk some myths.
The system is rigged
For those that say the system is rigged, I concur. In my assessment, central banks are largely responsible for a compression of “risk premia.” All else equal, quantitative easing and its variants around the globe have made assets from equities to bonds appear less risky than they are. This is at the very core of central banks efforts to entice investors to take risks, as risk taking is key to making an economy grow. In practice, central banks have foremost pushed up financial assets, but have largely disappointed in generating real investments. As a result, those holding financial assets have disproportionally benefited.
Hidden risks: liquidity
When I look at market risks, I feel like investors are in ‘la la land,’ ignoring the moonlight. Pardon the pun, I believe investors completely underappreciate hidden risks in the markets, notably the risk of liquidity evaporating. In today’s ETF driven world, to make ETFs track underlying indices, there are so-called market makers providing liquidity. Exchanges are providing incentives to these market makers; ever look at those exchange fees on your trade ticket? The exchange pays market makers from these fees for each share they buy or sell (ranging from fractions of a cent to multiple cents); such a “rebate” gives market makers a better price than you can possibly get, so they can cost effectively hedge their own risk, thus incentivizing them to provide liquidity. Each ETF has a so-called lead market maker that, by arrangement, gets a better deal than the other market makers. Through that, all the other market makers know they can always offload their risk to the lead market maker. Everyone is happy, including the investor. Except when the lead market maker has a glitch. Suddenly, just about everyone withdraws liquidity because something appears wrong. In addition, Dodd Frank discourages traditional market makers to provide liquidity. Flash crashes can then occur when investors place market orders in the wrong belief that the system will take care of them. As a result, in our opinion, the current design of the system makes the periodic flash crash a near certainty.
Risk is merely masked
In the past, I have compared central bank efforts to suppress risk akin to putting a lid on a pressure cooker. It should come as no surprise that taking the lid off might cause a spike a volatility, e.g., a taper tantrum. In the meantime, while the European Central Bank (ECB) and Bank of Japan (BoJ) are still ‘printing money’, the Fed is trying to raise rates.
Investors desperate for insurance?
We talk to a lot of investors who go along for the ride as the market is rising, but are rather concerned the party could come to an end. Instead of rebalancing their portfolios or taking chips off the table, however, they are looking for ways to have their cake and eat it too by buying insurance. One way to buy insurance on equities is to buy put options on equities. Another is to buy volatility, i.e. take a speculative position that volatility in the market is going to rise. Through ETFs, such strategies are available to retail investors. It turns out that buying insurance can be very expensive (at times more than 10% a month in case of buying volatility), making this not a prudent long-term investment. As with anything else in this analysis, we are observing what we see in the market, we not making an investment recommendation.
Selling volatility: a risky proposition?
It wouldn’t be Wall Street, if there weren’t investors on the other side of the trade of those trying to buy insurance: selling volatility has become a very fashionable trade. The idea is that so long as volatility stays low, one collects the equivalent of an insurance premium; when volatility surges, one loses money, those writing insurance might believe that those surges and associated losses are always temporary (buy the dips, remember!); over the medium term, so the logic goes, such a strategy promises to be profitable. To be clear: we do not recommend investors pursue this strategy even as such strategies have become increasingly popular. Amongst others, a single mutual fund pursuing a strategy building on that concept had amassed over four billion in assets. After all, what could possibly go wrong? What has gone wrong is that a few weeks ago, the fund experienced substantial loses in the absence of a surge in volatility. What appears to have happened is that a too-good-to-be-true strategy became victim of its own success. In our analysis, the fund encountered a particular constellation where their derivatives position was inherently difficult to manage, with difficulties exacerbated because of their size. Differently said, they were cornered. More than a few investors appear to have concluded that they didn’t sign up for the risks that materialized and have withdrawn their investments.
Market melt-up?
Above, we discuss a mutual fund being cornered. While the fund management brushed off that they would impact the market as a whole, our internal analysis suggests otherwise. As the fund is liquidating its position, the net effect on the market that we have observed is upward pressure on equities and downward pressure on volatility (this is due to how market makers hedge their books as they mitigate their own risk of helping the fund to unwind its position). While one can observe the stress in the market in characteristics of specific options, the casual observer might think everything is normal. The management of the fund indicated its troubles are over, but as of this writing, our assessment suggests they continue to be cornered as they liquidate positions to cater to redemptions. It isn’t just one mutual fund that tried to harvest carry from low volatility, we have seen the growth of an entire cottage industry. There’s a host of other strategies, including some of the so-called risk-parity strategies, that could similarly create market distortions if and when unwound. We believe it is plausible that much of the upward pressure in equity markets on the backdrop of low volatility may well be due to the unwinding of some of these strategies.
Fed being fooled?
If much of the feel-good-rally in the markets is due to internal market technicalities, is it possible that the Fed is being fooled? We have long argued that the Fed will raise rates if the market allows it to, meaning that they would love to have higher rates, but are most concerned about causing asset prices to deflate. That’s because we believe much of the recovery since the financial crisis has been based on asset price inflation. Moreover, we believe the Fed wants to avoid putting the economy into recession at just about any cost as they don’t want to revert to 0% interest rates and quantitative easing. They are emboldened by an economy that appears to be humming along, a market that appears robust and thinking that if they induce inflation, well, that’s a problem they know how to fight.
If, however, asset prices floating higher is actually an expression of stress due to exotic strategies being unwound, the Fed might well be emboldened to hike rates more aggressively.
Market crash?
The logical next question is whether investors are being fooled. If higher asset prices are more due to a short-squeeze than fundamentals, and if on top of that, the Fed is more aggressive, are we setting ourselves up for trouble? The stock market crash of 1987 comes to mind.
Does that mean investors should liquidate their positions? Does it mean investors should buy insurance? Regarding the latter, we’ve already pointed out that “insurance” might be very expensive. If you know the market is going to crash tomorrow, by all means, seek protection. That said, we have been cautious on the markets for some time and we have to be aware of the risk that our concern is misplaced.
Underperforming in bull markets
In my experience, investors swallow losing money in bear markets, but are furious if they don’t keep up with the averages during bull markets. When the smartest strategy is to buy the index, bright minds are leaving the industry. What you get is an obsession with indexing.
Beating the average is impossible
Not a week goes by that we aren’t told the merits of index based investing. The average active manager is failing to beat the index. Well, duh, that’s by definition: the average cannot beat the average once fees are included. But does that mean investors should stop thinking?
Buying the dips can be irresponsible
When markets are in a panic, the pundits tell us to buy the dips. As proof, they show the recovery we had from the market bottom in the financial crisis; or any other dip we have had since. With due respect, that too is the wrong way to look at the issue. Investors ought to invest according to how much risk they can stomach. If they had properly rebalanced, they would have taken chips off the table ahead of the financial crisis and then had the resources to deploy cash at the bottom. Yes, in that case, absolutely, buy when prices are cheap.
But that’s not how many portfolios look. Many investors go along for the ride during the good times, and are over-exposed to risk assets. They chase returns because they don’t have enough money to retire. Then, when the market plunges, they lose a great deal of their net worth. Are you telling me that the appropriate way to react in that situation is to double down and put a now disproportionally larger portion of your net worth at risk? If you cannot stomach the risk of an investment, stay away from it. When you lose money, you can afford to take less risk, not more risk. Any pundit suggesting otherwise is, in my opinion, irresponsible.
Don’t confuse indexing with lifestyle investing
If you are a pure index investor w.r.t. equities, you hold the S&P 500 Index and little else; unless you embrace a global view and invest pro-rata in global equities. Very few investors pursue that; instead, we have become what I call lifestyle investors: if you like green tech, you buy a green tech ETF. If you like biotech, you buy a biotech ETF. If you like,…, you get the picture. Sure, you aren’t picking stocks anymore, but you are picking winners and losers. Such a strategy may have worked quite beautifully in recent years because, well, because just about everything has gone up. As a result, if you work with a broker, he or she will have tailored your portfolio to what you feel good about. That’s fantastic, except if feeling good is all you are looking for, just take your kids to the ball game.
Fees matter
The one thing the indexing community has gotten right is that fees do matter. Again, this is math. If you pay less in fees, all else equal, your returns are higher if your fees are lower. As such, if you buy a popular market index through an ETF fees are very low. It’s not surprising that competitive market pressures have pushed prices lower. But it doesn’t mean investors should shy away from a more expensive product, if the segment it is in hasn’t been commoditized, i.e. when it provides value.
Robo-advisors do some good – and bad
In my assessment, the good news about robo advisors is that they have a rigid process to rebalance portfolios. I do not have a problem with anyone “buying the dips” if it is part of an otherwise comprehensive investment program. As I indicated earlier, I only have a problem with it if buying the dips is done for the wrong reasons, i.e. when it violates the risk tolerance of investors and when it is done in already lopsided portfolios.
What robo advisors can’t do is to fully assess the risk tolerance of investors when accounts are opened. I say that because I don’t think anyone or any machine can do that. Sure, we all fill in our risk tolerance when we open a brokerage account, but for most of us, these are abstract questions. We associate risk with upside risk, not downside risk. And let a portfolio really dive 25% or more, are you still comfortable with the risk tolerance parameters provided? This is a human weakness, but it doesn’t mean one can ignore it. I tell investors: if you get sleepless nights because of your investments, you are over-exposed. An investor should look at the most volatile periods and try to assess: would I really be comfortable holding x% of my portfolio in this security/fund if it went down as much as it did in 2008, or some other bad period? Such mind games are ever more difficult the further one is from the most recent crisis; with 2008 being far in the rear-view mirror, I allege there are millions of investors that have not properly assessed their own risk tolerance.
The bad of the early generation of robo advisors is that, in my view, they are too limited. They follow the most classic way of investing in stocks and bonds; that’s wonderful for normal times. But I question whether, after eight years of stock prices rising, we are in normal times. That said, because such model portfolios have done great, their sales argument is compelling.
In my humble opinion, investors may want to take advantage of the good while trying to mitigate the bad. That is, investors may want to have a rigorous investment process that includes rebalancing; they also should look at fees, although they should look at them in the context of what they are buying. If a robo advisor helps in terms of the “good” they may provide, great. However, so long as such investment strategies focus only on the basics, I would caution anyone not to deploy all their assets into such a strategy.
What shall investors do?
During extended bull markets, and the current market qualifies as such, I believe investors lose sight of what investing is all about. Call me old school, but I do not think investing is about chasing indices. Similarly, investing is not about lifestyle investing.
At any time, imagine what were to happen if markets were to crumble. How would you be able to pursue your investment goals?
If you have savings, you don’t need to chase investments; you can pursue your investment goals by looking for value; it’s okay not to participate in each and every market rally. If, however, you don’t have savings, you feel like you have to chase returns to catch up; in doing so, you are quite likely never to achieve your goals as you’ll invest at the top, then realize you are too exposed when prices tumble. In the opinion of yours truly, the irony is that even with modest savings, the more cautious approach should pay off more in the long run.
What do I do?
As a registered investment adviser myself, I am not allowed to give specific investment advice in a general analysis such as this one. But I can tell you that for myself: I seek to get my returns with as little equity risk as possible. My current view (which is subject to change at any moment) is that even as I believe equity prices are at risk of a severe correction, buying insurance is too costly given that I know as little about when the next bear market will come as anyone (I do have a hard time believing we’ll never have a bear market or financial crisis again). As such, I try to get my returns elsewhere. To the extent that I like specific equities, I hedge out equity risk (this is not an encouragement to use derivatives, as those come with their own set of risks that may not be suitable for many investors). Then, I look to generate return streams that are not correlated with equities. Those that have followed our work for some time know that I try to achieve at least some of that by investing in currencies and precious metals. Those are but two ways of trying to achieve uncorrelated returns.
We spend a lot of time on both macro and systematic work. While the heavy hand of policy intervention might be shifting from monetary to fiscal policy, I believe it is nonetheless important to gauge their impact on portfolios. With what I believe are distorted asset prices due to policy makers, we also spend a lot of time using other gauges, such as shifting risk sentiment in the markets.
The short of it is that there are many ways I believe one can weather the storm that may lie ahead in the markets. However, what may have been one of the more profitable approaches in recent years, namely to invest and forget, might be hazardous to your wealth in what’s ahead.
Please make sure you subscribe to our free Merk Insights, if you haven’t already done so, and follow me at twitter.com/AxelMerk. If you believe this analysis might be of value to your friends, please share it with them.
Axel Merk
Merk Investments, Manager of the Merk Funds
1 The S&P 500 return with dividends reinvested has been positive in each year since 2009. If dividends had not been reinvested, the return for 2015 would have been slightly negative. While one can generally not invest directly in an index, there are index funds tracking the S&P 500. Returns for investors are lower than those of the index because of fees charged by the index fund, as well as taxes that may be payable. Source for analysis: Bloomberg, Merk Investments LLC.
…also:

Rate hike odds surged as high as 80% following comments today from two Fed presidents. The odds are 62% as I am typing now. Let’s investigate the spike.
The Financial Times reports Market Odds of March Rise in US Interest Rates Hit 80%.
The market odds of a March increase in US interest rates shot up to 80 percent on Tuesday as Federal Reserve policymakers insisted they did not need to see Republican tax reforms and other policies before they act.
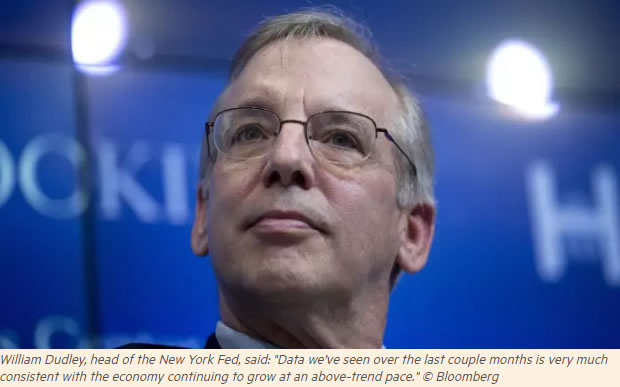
William Dudley, influential head of the New York Federal Reserve, said that the prospects for adding to the December 2016 rate increase had become “a lot more compelling”.
“It seems to me that most of the data we’ve seen over the last couple months is very much consistent with the economy continuing to grow at an above-trend pace, job gains remain pretty sturdy, inflation has actually drifted up a little bit as energy prices have increased,” he said in an interview with CNN.
Mr. Dudley is typically considered to be a dove on the Fed’s policy-setting board, so his remarks were “significant”, according to Thomas Simons, a money market economist at Jefferies, the investment bank.
“For Dudley, this is as hawkish and specific as you’re going to get,” he said
John Williams, president of the San Francisco Fed, said on Tuesday that a move would be “very much on the table for serious consideration” in March.
Parking the question of higher rates until June, on the other hand, would mean another half-year will have passed since the last rate rise in spite of surprisingly strong economic data.
New Standard for “Surprisingly Strong” Economy
I have no idea what “surprisingly strong” economic data they are referring to given that 4th quarter GDP is 1.9%, and the Atlanta Fed GDPNow model suggests 2.5% for first quarter.
Is 2% the new standard for”surprisingly strong” growth?
Yields Jump
Yields jumped across the board, but rates on the short end rose more than the 30-year long bond.
One-Year Treasuries

Two-Year Treasuries

30-Year Long Bond

Rate Jumps
- One-Year Yield +12 Basis Points
- Two-Year Yield +8 Basis Points
- Thirty-Year yield +5 Basis Points
Rate Hike Odds

If the Fed hikes, and I am not convinced they will, we will quickly learn more about the surprisingly strong economy.

-
I know Mike is a very solid investor and respect his opinions very much. So if he says pay attention to this or that - I will.
~ Dale G.
-
I've started managing my own investments so view Michael's site as a one-stop shop from which to get information and perspectives.
~ Dave E.
-
Michael offers easy reading, honest, common sense information that anyone can use in a practical manner.
~ der_al.
-
A sane voice in a scrambled investment world.
~ Ed R.
Inside Edge Pro Contributors

Greg Weldon

Josef Schachter

Tyler Bollhorn

Ryan Irvine

Paul Beattie

Martin Straith

Patrick Ceresna

Mark Leibovit

James Thorne

Victor Adair