
Bonds & Interest Rates
 You read that right. Not only is Italy selling 50-year bonds, but people are lining up buy them.
Italy’s first 50-year bond sale had huge demand
(Reuters) – Italy sold its first 50-year bond on Tuesday as some investors bet the European Central Bank may soon add ultra-long debt to its asset-purchase stimulus scheme.
About 16.5 billion euros of orders were placed for the bond – 5-1/2 times the expected sale amount, despite concerns over Italy’s banks and an upcoming referendum that could unseat its prime minister.
Many of the fund managers who lend to Italy – and those who have already bought 50-year bonds from France, Belgium and Spain this year – may not live to see it paid back. Those who signed up to Ireland’s 100-year bond in March almost certainly won’t.
But they could make quick gains if the ECB extends the maturity limit on its bond-buying scheme later this year, in an attempt to prolong its 1.7 trillion euro programme.
Analysts say such a move could be among tweaks expected in December to allow the central bank to continue quantitative easing beyond its scheduled end in March 2017.
“It is one of the least sensitive options from a political, technical and legal perspective,” said Frederik Ducrozet, senior European economist at Swiss wealth manager Pictet.
For those not familiar with Italy, a good place to start is the Wikipedia list of Italian prime ministers. Spoiler alert: They’ve had a million of them, and few have lasted more than a couple of years. This is the quintessential ungovernable society.
Meanwhile, its banks are pretty much zombies, loaded with fatal levels of bad debt but still shambling around thanks to repeated bailouts. The government runs consistently excessive deficits, so its debt load is growing at an unsustainable rate. And its people are more worried about protecting antiquated labor and tax regulations than competing successfully in a modern global economy.
And yet bond investors love the country’s debt. The reason, as the above article explains, is that no one thinks of these bonds as Italian. Once the ECB buys them up (at a nice premium to the initial sale price) they’ll become, in effect, German debt, guaranteed, via the ECB, by that much stronger, better managed economy.
So in the minds of bond buyers they’re not lending money for 50 years, but more like six months, until the ECB starts snapping them up. Which means the ECB is, in effect, directly funding the Italian government with newly-created Euros. Italy – and the rest of the peripheral eurozone countries – are thus handed an effectively-unlimited credit card allowing them to spend whatever they want, safe in the knowledge that it’s all covered by their friends in Brussels and Berlin.
Wonder how they’ll handle that freedom?

The Bank of Japan gave us a glimpse as to just how far down the rabbit hole we may have to follow global policy makers as we try to make sense of ever more complex and shall we say, innovative ‘tools’ being used in the effort to engineer individual economies and asset markets within the global financial system. BoJ announced it would conduct “JGB purchase operations” in order to “prevent the yield curve from deviating substantially from the current levels”.
The market initially interpreted this to mean BoJ stood in support of a rising yield curve, which would for example, help the banks (ref. MTU and SMFG, which exploded higher off of the support levels we had projected), but by the end of the week the Japanese Yield Curve had eased substantially and there seemed to be confusion about what the policy’s intent, or would-be effects, actually were. I wonder if the BoJ even fully knows what it is doing now. Lots of moving parts in a complex system.
As for the FOMC, it was non-business as usual. For all the pomp and bluster of the August-September Jawbone blitzkrieg we’ve been subjected to, the damn committee simply rolled over again, admonishing through hints that they really, really mean it when they imply a rate hike is still coming in 2016. But for now and to the surprise of very few, they did what they have done for the last 8 years; obfuscate and delay.
This time we even saw renowned dove Eric Rosengren rightly (in my opinion) shifting to the hawk side of the table as he observes a landscape of cranes to nowhere in Boston and extrapolates… ‘hmmm, I think we are blowing an asset bubble’. Yet still, the committee chaired by Janet Yellen – she of the hawk-tinged Jackson Hole Jawbone (with handy QE “tools” in her back pocket) went on to vote NO HIKE despite elevating CPI and soaring real estate, healthcare and services costs. Also, let’s not forget the ‘near all-time highs’ stock market, which unsurprisingly got an across the board price surge in response.
Where to now? Speaking as a lowly participant, I gave my stance in Friday’s in-day market update (profit retention). As you will see in this week’s report, weekly US stock market charts remain just fine, as we have noted for months now. But the daily charts of NDX and SPX used in the update gave some parameters to shorter-term correction potentials. What’s more, the global macro is a confusing mess. Japan took confusion to a new level last week, but the US is also a Wonderland of its own, post-2008.
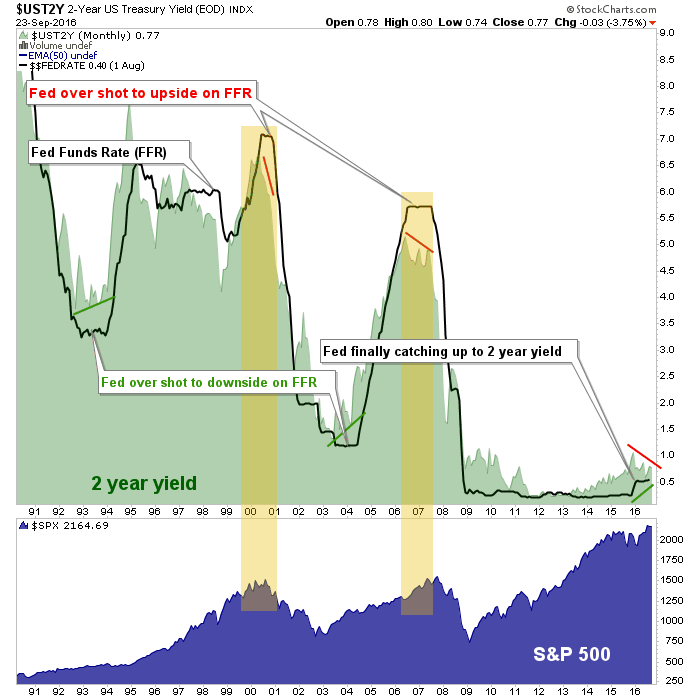
The chart above asks whether we are at a time like 1993/94 and 2003/04 or a time like 2000/01 and 2007/08. The interplay between the Fed Funds Rate (FFR) and the 2 year Treasury yield is – in my opinion, due to unprecedented bond market meddling under the Bernanke Fed – now dysfunctional.
Declining in 2016, the 2 year has been acting like it does at important economic and stock market tops, but Fed policy has not caught up to and exceeded the 2 year. We have long noted that the Fed decides nothing; the bond market makes the decisions. Yet the 2 year has been rising since 2013 and only in December of 2015 did the Fed decide to start to get in line with the message. Ever since then the 2 year yield has been declining, as it does at market tops, and this assuredly factors into the FOMC’s dovish rollovers.
Yet the starting point of this process is unlike any that came before. In 2000 the process began with yields above 6%. In 2007, above 5%. Today? 1% on the 2 year and .5% on the FFR. Those data points are lower than even the bombed out post-recession levels of 1992/93 and 2003, which preceded new cyclical bull markets.
Did someone say “confusing”? Did someone imply that even the likes of the Fed and the BoJ are confused? Did someone name a market report and associated service after the story of Alice in Wonderland during the lead-in to Q4 2008, when so many of the distortions built into the system were first introduced? I make a big deal about “playing it straight”, i.e. using the indicators and market signals for what they tell us, not what our most closely held views (biases) want them to tell us. But there is a highly technical term we can use for the chart above; it’s all screwed up.
Now there is little going on in macro markets that is conventional, and because of that it is difficult if not impossible for conventional analysts, quants and various other data miners to extrapolate forward in any accurate way. If the process noted above were coming from, say, 3.5% to 4% yield levels it would be easy to call it a ‘high risk, sell stocks’ atmosphere because all the ducks would be lined up and we would be believing the Fed when it poops rising interest rates talk out of its orifice. We could then expect the typical over shoot and ensuing bear market. I think that is what is coming, but the timing – in line with continual ‘obfuscate and delay’ of the Fed, is what is in question.
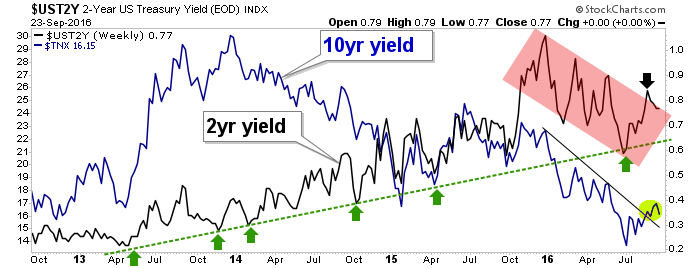
The chart above shows the ongoing 2016 downtrend in the 2 year yield. That is the plan that the Fed is following. Notice the big spike in October/November 2015? Notice the single Fed Funds Rate hike in December of 2015? Ever since then the 2 year has trended down and so the Fed has stood down. They ramp up the tough talk however when the dupes on the long end of the curve begin to get unruly. As noted recently, the 10 year yield broke its downtrend. About the only ones who would like that are the Banks, pigs that some of them are [insert Stumpf photo and time-wasting belly aching here].
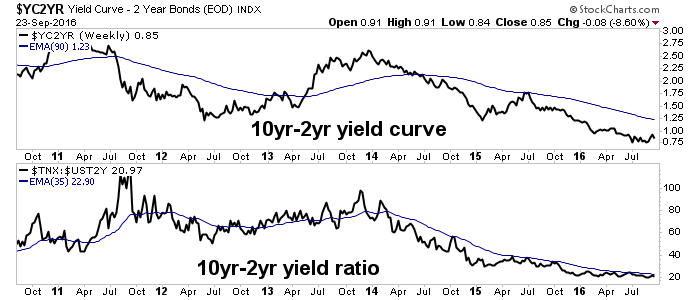
A rising yield curve is not what is happening yet, however. But if it were to happen confidence in the Federal Reserve would take another hit. So for now they ‘tough talk’ the bond market, holding that massive would-be .25% rate hike over our heads.
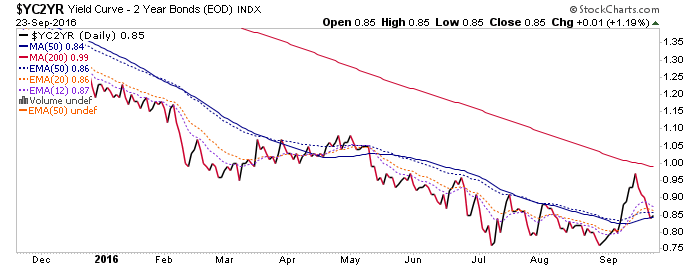
I think they’ll probably raise in December if the markets do not fall apart in the interim. They do have a bit of wiggle room before they overshoot the 2 year per the first chart above. Another hike would give them a second little nugget of credibility. But if long-term yields resume climbing at any point, the message would be inflationary and the Fed may have to chase the curve higher. If on the other hand, yields do not resume upward we’ll have seen the last rate hike in a long while. Here’s the daily yield curve; it is no wonder Fed sensitivities got stoked in September. Last week it was tamped back down.
….also: Hot Properties: Where Did Vancouver Scare Foreign Money To?
NFTRH.com and Biiwii.com

 On the heels of the Fed’s decision not to raise rates, today the man who has become legendary for his predictions on QE, historic moves in currencies, and major global events on why the world financial system is headed for total collapse.
Egon von Greyerz: “It was no surprise to me that the Fed did not raise rates today…
…related from Martin Armstrong:


Perspective
This week’s harvest of headlines records a lot of hope in the crude oil markets as well as remarkably reckless borrowing. Matched, of course, by the equivalent in lending.
All without a regard for how the debt will be serviced. Financial history is at the point where the real power shifts from the Federal Reserve System to Mister Margin. It has many times since 1913 and since the advent of reckless central banking the roles of each side have become very distinct.
The Fed’s ambition is to get the accounts fully leveraged or “out of line”. This has been impressive. Mr. Margin’s job description is to get the accounts “in line” and that will be done.
It could take until November.
The following is part of Pivotal Events that was published for our subscribers September 14, 2016.
Stock Markets
Market dynamics have been outstanding. Outstanding in setting a series of important tops, perhaps adding up to “Peak” for the senior indexes and a big “Rounding Rebound” for the broad market.
Our case has been is that central bank equity buying had to focus upon the big stocks— the “Nifty 500”.
With so many central banks buying the popular trades, Long Term Capital Management (LTCM) comes to mind. It was in 1998 and LTCM had an outstanding reputation in theoretical pricing of options. So outstanding, that senior central banks made direct loans to the highly leveraged fund. The Bank of Italy did this and took an equity position as well.
The wager was that with the European Union, credit spreads would narrow. That was the theory. We pointed out that even with the serious discipline of a gold standard spreads did not narrow to a common level.
On a natural turn to widening that summer LTCM was suddenly and irrevocably offside. It lost $4.6 billion in less than four months.
The fund collapsed to effectively less than zero and the distress amongst the central banking community was palpable. This added to the overall panic.
Now there are many central banks that are very long, as we note, the popular trades, including equities.
“Come on in – all the lemmings are doing it!”
In 2000 and 2007, the Street stayed long because the Fed would “cut rates”. This is not an option now, so the equivalent mojo is that central banks will “buy more assets”.
Rather an interesting evolution of the “Greater Fool” theory.
As with previous market peaks, credit strains are becoming visible and are forcing stock markets down.
How far?
It will take a cyclical bear to clear the financial excesses.
The hot leading sectors accomplished speculative excesses that were noted as they occurred.
The action in Utilities (XLU) climaxed in early July. Base and Precious Metal Miners (XME and HUI) at the end of July. All three are breaking down.
Over in the financials, last week we noted that the action in XLF has registered an Upside Exhaustion as well as a Sequential Sell. Enough technical excess to call for another “Widows & Orphans Short”. The last one was in July last year and mainly based upon the action in Wells Fargo.
BKX fell from 80 to 53 in February and has rallied up to 72. The recent technical readings are more comprehensive than last year’s.
Transports did not confirm the Dow high and have slipped below the 50-Day moving average at 7854. Now at 7771, through the 200-Day at 7624 would turn the chart down.
On the broad market, the NYA did not set new highs and we have been watching the 20- Week ema. This is at 10568 and with the index at 10505 today, the break is significant.
The equity wager now is not on a “Fed cut”, but that central bank promises to buy assets will be effective.

Currencies
Once again it is time to review the theory that currency depreciation is the mojo for economic growth. And when that theory is faltering depreciation becomes the preventer of bad things.
Of course, veteran traders have never really gone along with this.
The most glaring thing out there is that the theory has never worked. Now it is becoming more apparent.
The question has always been. When do the Federales learn to doubt?
The next dollar rally may instruct.
Since the first of August, the DX has been in a trading range between 94 and 96.25. The last low was last week at 94.39. At 95.50 now, there is resistance at the 96 level which is between the 50 and 200-Day moving averages.
Technically, the DX needs to get above the 20-Week ema to start the rise. This would be similar to the “launch” in July 2014.
It got slightly above last week and the ema is at 95.61.
Bonds

- Sequential Sells were generated going into the top.
- That was on the 9 and 13-Week readings.
- The 20-Week ema governed the corrections on the way down into late 2015.
- The same ema governed on the way up.
- Taking it out will formally turn the global treasury market down.
Ampersand
Been reading an interesting diary from the late 1700s.
Hazards of country life:
September 21, 1786
A Country Parson
James Woodforde’s Diary 1759-1802
“My Brother John indifferent to day being merry last Night and very near killed last Night going home from Ansford Inn to his own House on horseback and falling off – his face is cut but little however….”
On Travel:
October 11, 1786:
“Whilst we were at Newmarket and changing Coaches and Luggage, found that a small red Trunk of my Nieces was left behind in London, in which were all her principal Matters – It vexed her at first very much – but on my assuring her that I saw it safely lodged in the Warehouse, she was more composed. I would not pay the remaining part of our fare or for our Luggage till the Trunk was forthcoming….”
BOB HOYE, INSTITUTIONAL ADVISORS E-MAIL
bhoye.institutionaladvisors@telus.net
WEBSITE: www.institutionaladvisors.com
Listen to the Bob Hoye Podcast every Friday afternoon at TalkDigitalNetwork.com
After one the biggest rallies in the last seven years off the Feb lows, high-yield bond investors are rushing into bearish (hedge) positions 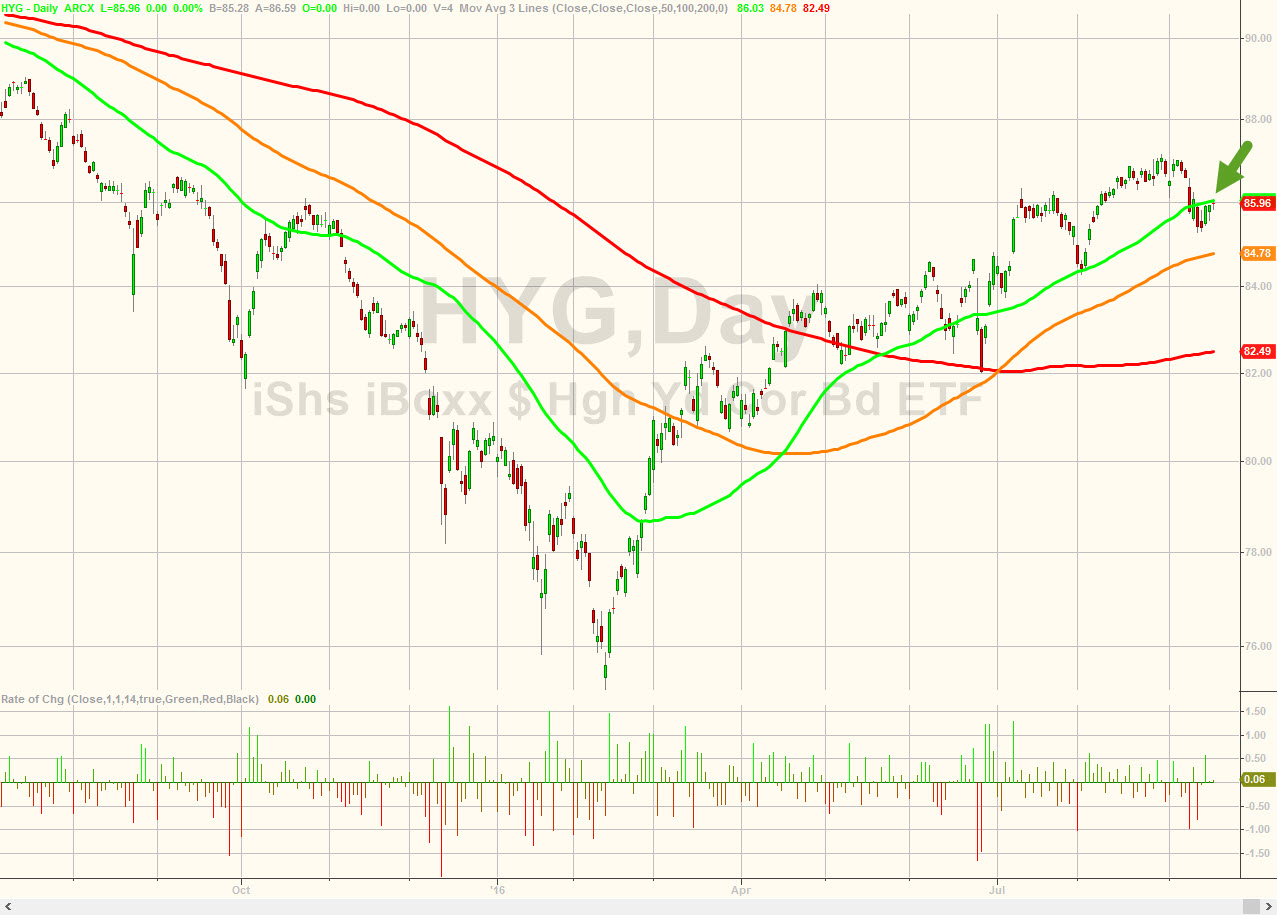 ahead of this week’s Fed/BoJ spectacle. Put volume (protecting downside) in the last few days has soared to levels only seen around Brexit and last December’s Fed rate-hike as Bloomberg notes, investors have already become skittish on signs that global central banks may turn off the spigot.
HYG has seen a yuuge surge off the Feb lows…
….related:

-
I know Mike is a very solid investor and respect his opinions very much. So if he says pay attention to this or that - I will.
~ Dale G.
-
I've started managing my own investments so view Michael's site as a one-stop shop from which to get information and perspectives.
~ Dave E.
-
Michael offers easy reading, honest, common sense information that anyone can use in a practical manner.
~ der_al.
-
A sane voice in a scrambled investment world.
~ Ed R.
Inside Edge Pro Contributors

Greg Weldon

Josef Schachter

Tyler Bollhorn

Ryan Irvine

Paul Beattie

Martin Straith

Patrick Ceresna

Mark Leibovit

James Thorne

Victor Adair