
Bonds & Interest Rates
 When the Bank of Canada cut the overnight rate in response to the oil price plunge last year, it reduced the cushion between it and the other central banks who are engaged in non-traditional monetary policy.
After years of relying on monetary policy to lift Canada’s GDP, investors now look to the federal government to help provide a fiscal bridge to more sustainable economic growth. We believe Canadian real GDP will grow this year at 1.25%–1.75%.

Carl Icahn and George Soros are two incredibly influential and well respected investors who have recently turned against the markets and taken on large short positions. These investors, as I have recently written about, are forecasting doom and gloom in our future and envisioning a time of collapsing prices in the markets. They should not be ignored, nor should they be dismissed.
Many of us in the precious metals community also see the writing on the wall. We see the disease and rot that has set within the market’s heart. We see the out of control and reckless spending by Central Banksters and shudder with fear, for we also envision a collapse of epic proportions. No longer are we alone, nor can we be called “tin foil hat” wearers anymore. Our truths can no longer be denied and they are not going unheard.
More and more daily are waking up to this reality, including, as we indicated, some of the most prominent names in the industry. Most recent to join the ranks is Bill Gross, arguably the most well-known investor in the bond markets.
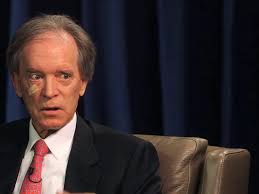 Bill Gross has recently come out and said that the “system itself is at risk” and that a “day of reckoning is coming”. Ominous words indeed, but sadly, the truth.
Putting his money where his mouth is, Bill Gross is defying all of his instincts as a bond investor and is revamping his $1.3 billion “Janus Global Unconstrained” Bond Fund. He is moving his fund into a position to sell insurance and credit risk.
These actions are brought on by his deep fear that the market is going to break down in the future. He believes Central Banker stimulus has artificially propped up the markets and this illusion we live in is no longer going to last. The proof of this is in the fact that stimulus by Central Bankers is having less and less effect, even as more and more money is printed.
He also fears that the US government is heading down the path of Japan and envisions a day when the government buys up all the debt, eliminating and forgiving it. This of course would be wildly inflationary and be an admittance that the end is nigh on their own part, likely ending in an epic collapse of the Western monetary system.
The writing is on the wall and as each day passes, there is more and more smart money coming to this conclusion. At some point a tipping point is going to be reached and the markets are going to break.
Those with their wits about them are simply getting ahead of the curve and acting before it’s too late. Are you?
…more from Bill: Bond King Bill Gross Calls For Trillions In Fed Money Printing For Jobless Americans: Financial Advisors’ Daily Digest

This one is going to cause some cognitive dissonance, because many of the people you trust and rely upon for financial insights are bullish on bonds and think that interest rates will go even lower.
I do not.
I think they will go higher, and I have a fairly well-reasoned case.
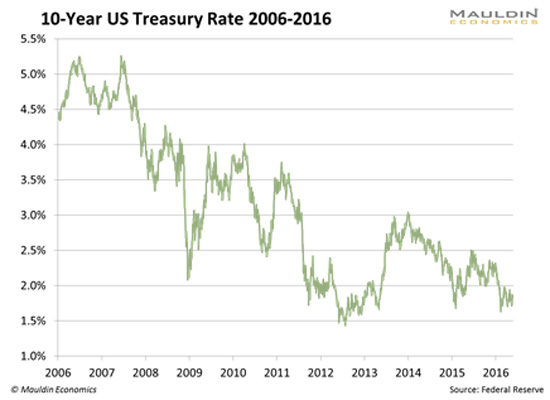
First, a chart of 10-year yields over the last 10 years:
And going back a lot further than that:

Let’s step through this bit by bit.
Inflation
If you are a bondholder, what is your greatest enemy?
Inflation.
Think about it. If you own a 10-year piece of paper yielding 2% and inflation is running at 3%, you actually have a real yield of -1%. That doesn’t sound very good. As it stands right now, real interest rates in the 10-year space are just slightly above zero.
For those of you who have a little bit of background in this, interest rates have a nominal and a realcomponent. The nominal component compensates you for inflation. The real component reflects the supply and demand for loanable funds.
When there is an excess supply of loanable funds (like after the Fed has printed a lot of money), interest rates will be depressed, as they are now. When there is an excess demand for loanable funds, like when there are lots of investment opportunities, interest rates will rise.
This is all academic. But the academic stuff works sometimes, too.
So here is a chart of inflation (CPI):
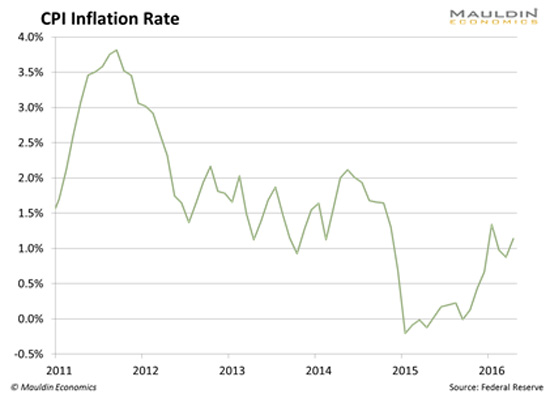
You can see that it is starting to turn up. Yes, inflation is low, but it’s the direction that counts.
So why would you buy a bond when inflation is getting ready to ramp up?
Worse, there are plenty of indications that inflation is going to run further. 10 years ago, inflation was running about 3–4%, but people were saying that we didn’t really have inflation, because we didn’t have wage inflation.
Well, guess what: now we are starting to have wage inflation. People are very noisy about this with respect to the minimum wage, and by the way, after the last year or two, almost nobody pays the minimum wage of $7.25 an hour anymore. Walmart, TJ Maxx, and many others have all raised wages on the low end.
This feeds into expectations, where people come to expect more and more pay increases. And when people demand and receive pay increases, they have more disposable income and drive up the price of goods and services.
So if we didn’t have “real” inflation before, do we have “real” inflation now?
Supply
Leaving aside the anti-immigration stuff for a moment, I’m not a fan of Donald Trump. For one reason and one reason only: the debt.
A few weeks ago, in Forbes, I argued that a President Trump would be very bad for the bond market. Let’s talk this through.
Donald Trump wants to cut taxes. He wants to cut the top marginal rate from 39.6% to 25%, and all the other tax rates as well. He wants to make it so most people don’t pay taxes at all. The “cost” of this tax plan is about $1.3 trillion, but if we dynamically score this and say that there will be economic growth as a result of it and the government will take in more revenue (the supply-side argument, which I agree with), let’s just assume it’s a trillion-dollar tax cut.
Trump also wants to…
- Build a wall
- Deport people
- Build infrastructure
- Have Trumpcare
- Increase defense spending (exclusive of military adventures)
Let’s say that on the expense side, this costs an additional $1 trillion (Trump is not a small-government conservative).
So the deficit, which is currently at about a half-trillion, goes to $2.5 trillion, or about 15% of GDP, the highest in history.
The debt is little more than an abstraction to most people, but the mechanics of what happens when a government runs a large deficit is that the treasury will increase the size of its bond offerings. So if the US Treasury is offering $20 billion of bonds every quarter, and the deficit doubles, it will be offering $40 billion of bonds every quarter. There’s an increase of supply, and without a corresponding increase in demand, investors will demand price concessions and interest rates will rise.
This is the argument Robert Rubin was making about the debt in the 1990s. And he was right.
Under a Trump regime, the volume of bonds that would be offered for sale would skyrocket. Never mind Trump’s creditworthiness in general, and the fact that he’s made an entire career of screwing creditors. I would not want to lend money to the US government under such circumstances.
Under Hillary Clinton, the situation would be better, but only marginally, because over time, our entitlement programs will grow more and more expensive (and untenable).
Conclusion
I have about eight other bullet points to make, but I try to keep The 10th Man succinct. Let’s be clear—the bond market is as overpriced as it has ever been, right at the moment that the fundamentals have completely broken down.
Where does the exposure live? With you, the retail investor.
There are hundreds of billions in household assets in fixed-income mutual funds, retirement and nonretirement. After a 1% rise in interest rates, people will discover what the meaning of “duration” is.
But that is a topic for another time.
Jared Dillian
Click here for anintroductory offer
related from Larry Edelson: “Something Has Radically Changed”
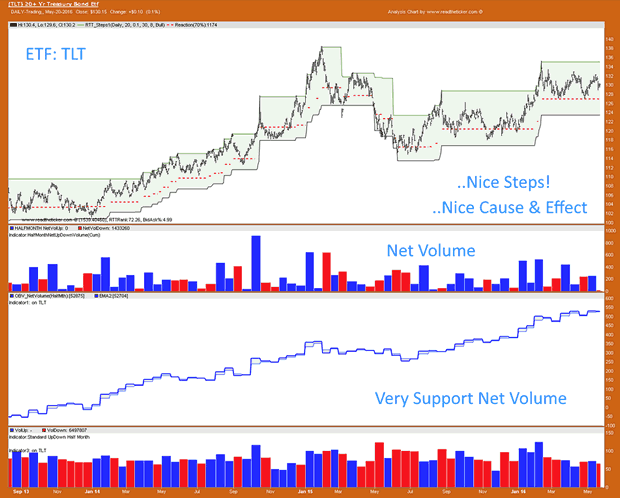
The TLT includes US Bonds maturing between 20 and 30 years. The TLT chart shows no fear of the US FED raising rates. It looks strong and higher prices should be expected in the months ahead. Higher prices means lower average bond yield or lower interest rates are expected. Simply the folks supporting the TLT price do not believe the FED is on a long term rate hike plan.
The chart below is showing off RTT NetVolume tools.(RTT = readtheticker)
Investing Quote…
“Anyone who buys or sells a stock, a bond or a commodity for profit is speculating if he employs intelligent foresight. If he does not, he is gambling.” ~ Richard D Wyckoff
“To me, the ‘tape’ is the final arbiter of any investment decision. I have a cardinal rule: Never fight the tape!” ~ Martin Zweig
“It’s not what you own that will send you bust but what you owe.” ~ Anon
“In the short run, the market is a voting machine, but in the long run it is a weighing machine.” ~ Benjamin Graham
“If past history was all there was to the game, the richest people would be librarians.” ~ Warren Buffett
Also:
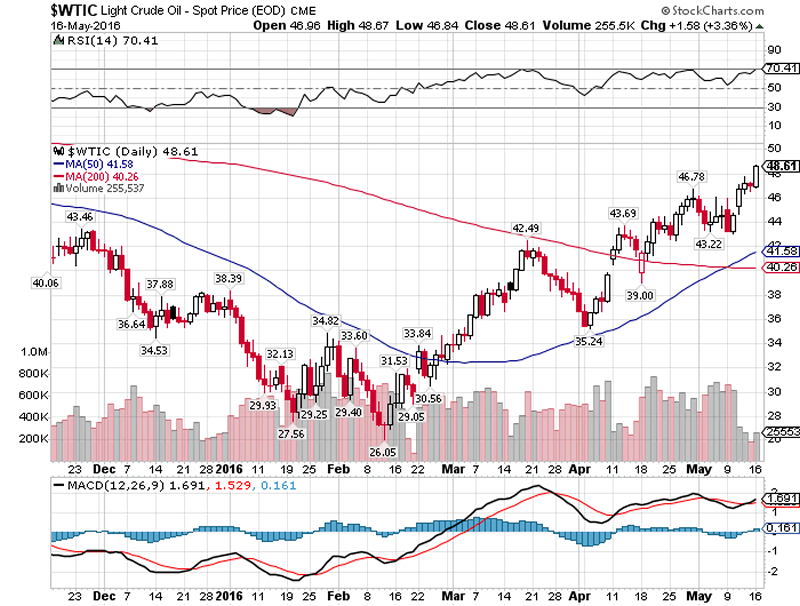
Implications for Stock Market – “the oil price has clawed it’s way back relentlessly through a series of critical levels of first $30, $35, $40, and most recently popping above $45 to stand at a high for the year of $48! Nearly DOUBLING in THREE MONTHS!”
At the start of the year the prevailing mood in the oil market was not just one of gloom and doom but of catastrophe as the oil price sunk below $30, skidding by the middle of February to virtually touch $25, a period during which many prominent analysts and investment banks such as Goldman Sachs all of whom were bearish on the prospects for oil prices this year some even suggesting that the oil price could sink to as low as $10 (Standard Chartered) which meant that the oil producers large and small, the frackers and even a string of nations such as Russia, Nigeria and Venezuela were on the fast track towards going bust as their oil profits that financed their state spending budget deficits evaporated.
We’ll barely 4 months on and the oil market has gradually transformed from that of imminent $10 apocalypse to one of hopeful recovery as the oil price has clawed it’s way back relentlessly through a series of critical levels of first $30, $35, $40, and most recently popping above $45 to stand at a high for the year of $48! Nearly DOUBLING in THREE MONTHS! And now all those who failed to see this coming are now forecasting higher prices i.e. one of the biggest oil bears of the year, Goldman Sachs now reckons the oil supply glut has evaporated and oil prices are going to reach $51, WOW crude oil has already risen to $48!
These are the SAME fools who have been banging the drums all year for an sub $20 oil price, but now AFTER the oil price has DOUBLED are proclaiming themselves as being bullish! This illustrates an important point! Goldman Sachs and the REST are nothing more than snake oil salesmen! They clearly don’t make money trading as you or I understand it to be, for if they did they would be back to being just as bankrupt as they were during the financial crisis. Instead they make their money by doing dubious deals such as that which bankrupted Greece, by means of hiding their debt!
Crude Oil Price Trend Forecast 2016
In terms of my oil price forecast for 2016, my in-depth analysis of Mid January forecast expectations for the crude oil price to bottom by early February at approx $25, the actual bottom came in at $26 and within the time window for a final bear market bottom as the following video analysis and article excerpt illustrate:
17 Jan 2016 – Crude Oil Price Crash Triggering Global Instability, Trend Forecast 2016
Crude Oil Price 2016 Forecast Conclusion
My forecast conclusion is for the crude oil price to trade within three distinct trading ranges for 2016 of $20 to $40, $35 to $50 and $62 to $40. Furthermore the trend pattern imposed onto the trading ranges implies that a bottom is likely by early February 2016 at around $25, followed by a trend higher into Mid year towards $50, a correction into September, followed by a trend towards $62 before succumbing to a correction during December to target an end year price of approx $48 as illustrated by the following forecast graph.
Crude Oil Price Forecast 2016 Implications for Stock Market Trend
My latest video analysis seeks to update what has transpired since, and whether the crude oil price remains on track to to continue trending towards $60 before the end of this year, and what this means for the stock market that I have consistently stated should track the crude oil price rally higher, whilst many if not most have long since convinced themselves that stocks were not only in a bear market but that a crash was always liniment! So found out the prospects for oil and the stock market in my latest video analysis –
related: The Oil Crash Is Over


-
I know Mike is a very solid investor and respect his opinions very much. So if he says pay attention to this or that - I will.
~ Dale G.
-
I've started managing my own investments so view Michael's site as a one-stop shop from which to get information and perspectives.
~ Dave E.
-
Michael offers easy reading, honest, common sense information that anyone can use in a practical manner.
~ der_al.
-
A sane voice in a scrambled investment world.
~ Ed R.
Inside Edge Pro Contributors

Greg Weldon

Josef Schachter

Tyler Bollhorn

Ryan Irvine

Paul Beattie

Martin Straith

Patrick Ceresna

Mark Leibovit

James Thorne

Victor Adair