
Bonds & Interest Rates
Summary
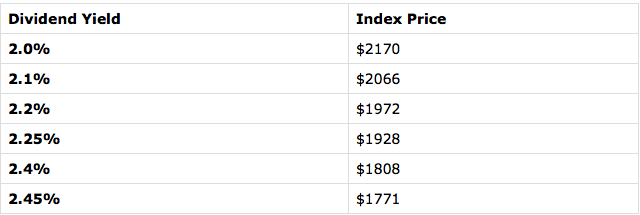
Since 2009, the dividend yield on the S&P 500 Index has stayed between 1.8 and 2.2 percent until recently.
As of Friday’s close, the dividend yield on the index was 2.31 percent, which suggests that stock prices should go up to bring the yield back into the range.
Even if we assume that the range should be moved up based on recent Federal Reserve action, we would still have a range of 2.0 to 2.4 percent.
Under this new range, the midpoint would be 2.2 percent, suggesting that 2.31 percent is an attractive entry point.
This is confirmed by the fact that the dividend yield on the index is now higher than the yield on 10-year treasuries.

 In case it weren’t completely obvious how completely screwed up the financial system is, please allow me to introduce Exhibit A: the Federal Reserve’s own balance sheet.
First we need a quick accounting background. And, stay with me, because this is important.
Think about your own finances. You, me, everyone… we all have assets and liabilities.
Your assets might be things like cash, your house, car, baseball card collection, etc.
And your liabilities are loans, credit card debt, etc.
The difference between the two can be thought of as your ‘net worth’. And hopefully it’s positive, i.e. your assets exceed your liabilities.
In accounting, this concept of net worth is known as ‘equity’. A company like Apple that has a lot of assets but not a lot of debt has substantial equity.
(As an investor, I typically look for opportunities where I can buy a great business or its shares for less than its equity. But we’ll save that for another time.)
Banks, too, have assets and liabilities.
But while the balance of your savings account may be an asset for you, or the mortgage balance you owe to the bank is your liability, for the bank it’s actually reversed.
Your savings account balance is actually money that they OWE you.
So while your savings is an asset for you, for the bank it’s a liability.
Similarly, your loan balance might be your liability.
But for banks, the loans they make to customers are actually assets because they’re on the receiving end of the loan payments.
For a bank, net worth (known as a bank’s ‘capital’) is a massively important indication of its financial health.
Think about it– if a bank has a negative net worth, this means that it doesn’t have enough assets to repay its customer deposits.
This is how banking crises start. It’s precisely why Lehman Brothers (and a whole lot of other banks) went bust in 2008/2009. The banks’ liabilities exceeded their assets.
Conservative banks hold vast amounts of capital, i.e. have substantial a net worth where the value of their assets drastically exceeds liabilities and customer deposits.
One way of looking at this is by measuring a bank’s capital as a percentage of its total assets. (Conservative banks have a high percentage.)
Let’s say a bank has $1000 in assets like cash and loans, and $200 in liabilities (customer deposits).
This means that the bank has $800 in capital, which constitutes 80% of its total assets.
In other words, the value of the bank’s assets can fall by 80%, and the bank would still be able to repay its depositors.
This is a huge margin of safety that is unfortunately almost unheard of in banking.
Right before the crisis, in fact, Lehman Brother’s capital was just 3% of its total assets.
And that leads me to central banks.
Just like regular banks and businesses, central banks also have assets and liabilities.
In the US, the Federal Reserve’s assets total $4.486 trillion, including more than $2 TRILLION in US government debt.
The Fed also has total capital (i.e. net worth) of $39.5 billion.
That sounds like a lot. Until you realize that it constitutes just 0.88% of its total assets. Not even 1%!
This is a tiny, almost nonexistent level of capital at the Federal Reserve.
Put another way, the issuer of the United States dollar, the most widely used currency on the planet, and the central bank of the largest economy in the world, has almost no margin of safety.
This puts the entire global financial system at a tremendous level of risk.
Central banks can and do go bankrupt. It happened most notably in Iceland back in 2008, causing an epic currency crisis in that country.
So running the Fed’s balance sheet down to the nub like this is not exactly a consequence-free course of action.
But what’s really astonishing about all of this is how quickly the Fed’s balance sheet deteriorated. And why.
Just two weeks ago, the Fed’s total capital was nearly $59 billion. And even that wasn’t very much given the size of its balance sheet.
Today it’s $39.5. This is an incredible 33% drop in just two weeks!
Imagine your net worth collapsing by 33% in two weeks; it would probably be a huge personal crisis. Yet the Fed seems completely cool about it.
I did some digging and found out why this happened.
It turns out that Congress and the President passed a law last month called the Fixing America’s Surface Transportation (FAST) Act.
We’ve talked about this one before– the FAST Act is supposed to provide funding for America’s highway system.
But one of the provisions is that a US citizen can have his passport revoked if the government believes in its sole discretion that he owes too much tax. Crazy.
And, buried deep within the nearly 500 pages of legislation is a neat little section demanding that Federal Reserve bank surpluses above a certain amount must be turned over to the United States Department of Treasury.
In other words, the US government is so broke that they’re now confiscating assets from the Fed, putting the entire global financial system at even more risk.
It’s genius!
You just can’t make this stuff up. It’s so absurd it would be comical if it weren’t true.
So, yes, it should be completely obvious by now that there is a tremendous amount of risk in the system.
Governments are completely bankrupt. And even central banks now are being pushed into insolvency by the bankrupt governments they support.
This is not a story that has a happy ending. And whether the consequences arise today, tomorrow, or five years from now is irrelevant.
This is a major risk. And for any thinking, rational person paying attention, it’s imperative to have a Plan B.
Enjoy the weekend,
Simon Black
Founder, SovereignMan.com
Neither this email nor content posted on the website SovereignMan.com is intended to provide personal tax or financial advice. Before undertaking any action described in this letter, financial or otherwise, you should discuss your options with a qualified advisor– tax accountant, financial planner, attorney, priest, IRS auditor, Bernie Madoff, etc.
If you’d like to update your email address or no longer wish to receive our daily emails, click the link below: Update email or unsubscribe
Publisher of Sovereign Man
30 Cecil Street #19-08
Singapore, Singapore – No State 049712
Singapore
 The Federal Reserve’s recent rate hike is symbolic, intended to signal the end of the financial crisis and the start of normalization.
The rise will have minimal effect on consumption and investment. Analysts have already moved beyond the Fed’s well-telegraphed decision, focusing on the future trajectory of U.S. monetary policy.
The Fed forecasts around four additional rate increases in 2016 and a similar number in 2017. This would mean that U.S. official rates would be around 1.375% and 2.375% by the end of 2016 and 2017, respectively. The median estimate for the longer-term federal funds rate is around 3.5%.
Yet the central bank’s moves may be more gradual than most Fed-watchers expect. Here’s why:

We believe the Credit Cycle has turned and with it will come some massive unexpected shocks. One of these will be the fall out in the Bond Market, centered around the dramatic growth explosion in Bond ETFs coupled with the post financial crisis regulatory changes that effectively removed banks from making markets in corporate bonds. It is a ‘Witch’s Brew’ with a flattening yield curve bringing it to a boil.
2000 – Flat to Inverted Yield Curve
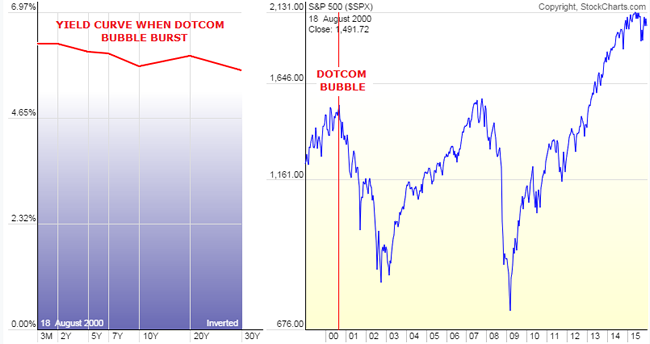
2007 – Flat Yield Curve
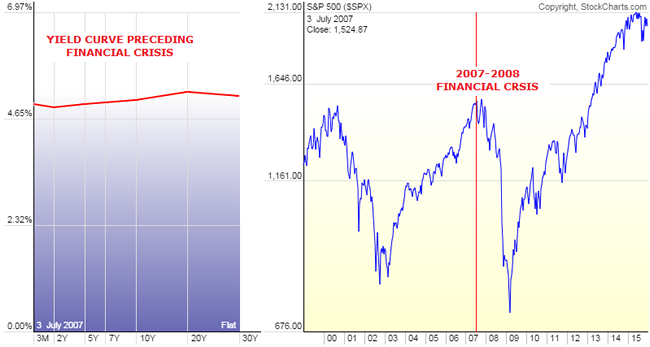
TODAY – Signalling a Flattening at Seriously Lower Bound!
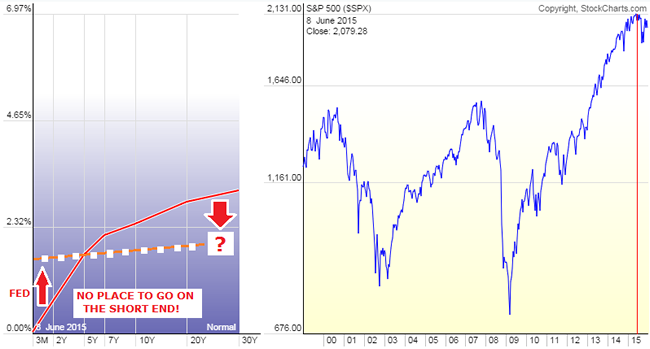
PRESSURES FLATTENING THE YIELD CURVE
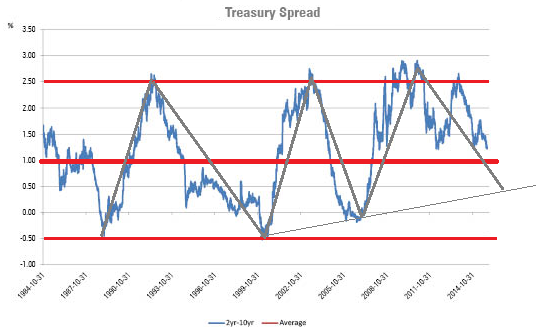
In the last six weeks, the spread between the Ten Year and the Two year treasuries has flattened exactly 25 basis points, which is EXACTLY the same amount that the Fed just moved the Fed Funds target rate this past Wednesday. With investors starved for yield many are being forced further out on the yield curve taking rates down further and pushing prices up.
Dan Norcini at http://traderdan.com lays it out pretty clearly:
This horrific predicament, compliments of our masters at the Central Banks, is forcing money to chase yield meaning that it is going further out along the curve to the long end. The more money that enters any bond market, the LOWER yields go since bond prices move inversely to the yield. When demand for anything increases, its price rises. Bonds, bills, notes, are no exception. As the money flows increase into the long end of the curve, at a faster rate than the money flows might be increasing into the shorter end of the curve, the price of the longer dated bonds rises faster than the price of the shorter dated bonds ( bills, notes,. etc). That means a flattening curve.
Secondly, and something that is extremely relevant to what is going on here – FOREIGN INVESTORS are sending monies overseas to chase yield as well. Think of where interest rates are in both Japan and in the Eurozone compared to comparable dated government debt here in the US. Those foreign flows do two things. They boost the price of the longer dated Treasuries as well as boosting demand for US Dollars.
This phenomenon tends to support both the Dollar’s value on the foreign exchange markets as well as keeping prices for those longer dated Treasuries well supported. Again, bond prices move inversely to yields thus the more money flows into the longer dated treasuries, the more those yields tend to move lower.
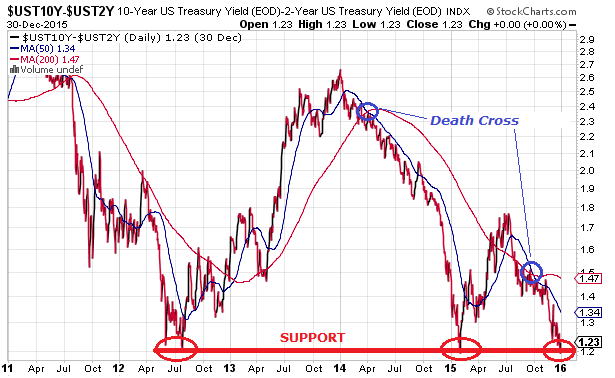
Look at what the result of both of these above factors have done to the yield on the Ten Year Treasury. Its yield was 2.170% on the last day of 2014. Today, its yield is 2.19%. We are only a short two weeks away from ending this year and we are basically back to where we started this year. We have essentially gone nowhere on yields.
What is perhaps even more alarming is that the curve is flattening further. The low point on this spread occurred in early February of this year when it reached 1.19%. Today, it closed at 1.22%. We are talking about a mere 3 basis points from the curve having flattened to a 2015 low!
Clearly, this is NOT A VOTE FOR STRONG ECONOMIC GROWTH laying ahead.
Perhaps this is the reason that the equity markets are beginning to show signs of wobbling.
What some analysts have been saying is that once the Fed started to raise rates, the stock market would come under pressure because the move would be a signal that the Fed has begun the process to slowly drain the liquidity that has fueled its monster seven year rally. I personally take issue with that in the sense that the Fed has not made any move towards actually reducing liquidity that I am aware of. After all, while they did increase the short term target rate by 1/4%, one can hardly say that the interest rate environment is not accommodative. Furthermore, the size of its balance sheet remains the same as it has been in some time nor have I seen any talk coming from the Fed that it intends to reduce that balance sheet.
Here is a chart of the Fed Balance Sheet beginning in October of 2013 ( I chose this month at random). Notice how constant the line has remained over the last year. As you can see, there has been no shrinking of the Balance sheet.
What I think appears to be causing concerns in the stock market is the fact that the yield curve is signaling that economic growth is not going to be increasing. That has gotten some stock investors nervous that perhaps stocks are overvalued. After all, it is hard to make the case that the equity markets should be hitting new lifetime highs when the yield curve is collapsing.
THE “WITCH’S BREW”
Many Including Morningstar Have Hyped “The Great New Yield Opportunity”
Thanks yet again to innovation in the realm of exchange-traded funds, the walls have come down and individual investors now have efficient access to tools that enable them to implement a strategy that only the big boys on the block could implement. Without the benefit of such scale and low relative trading costs, the cost hurdle was far too high for most individual investors and advisors trying to implement this strategy using individual bonds.
Then came along a new breed of fixed-income fund that combines the diversification and accessibility of an ETF with the precision of an individual bond. While an index, for example, typically maintains a fairly stable maturity range, these ETFs have specified maturity dates upon which cash is distributed back to investors. That means, just like an individual bond, the duration of these ETFs will steadily decrease as it approaches maturity.
…..
These ETFs are typically pitched as a way to build bond ladders in order to match cash flows with future liabilities. But thanks to their precise exposure and individual bondlike characteristics, defined-maturity ETFs–which are relatively cheap to trade–are also great tools for executing customized “roll down” strategies to enhance fixed-income total returns.
Even for relatively large investors, the wide bid-ask spreads and dealer mark-ups or commissions incurred when buying and selling individual bonds present a high hurdle. Moreover, the minimum investment that would be required could be another barrier to entry. Often, investors will be dealing in “odd lots,” which typically trade at wider spreads, as they are considered less liquid.
One of the attractive traits of an individual bond is the visibility of its cash flows and knowing exactly how much principal is due to you at maturity. Contrast that against a bond index, which does not mature and will see slight variations in its cash flows as it rebalances or reconstitutes over time. In the case of an actively managed portfolio, the payout will fluctuate as the portfolio manager buys and sells bonds. While there are several ETFs that target a relatively narrow portion of the yield curve, they still lack the precision and flexibility of defined-maturity bond ETFs.
This is another example of ETFs democratizing the investment landscape. Armed with these innovative solutions, investors have yet another arrow in their quivers to manage their fixed-income allocation amid a low-interest-rate environment. Be sure to monitor the steepness of the yield curve when executing the strategy, and keep in mind that the “roll down” strategy will lose a lot of steam if the yield curve flattens more than expected. As great as it sounds on paper, this strategy is still not a free lunch. The buy-and-hold investor sees price volatility steadily decease as his bond nears maturity. However, the price volatility in the “roll down” strategy stays relatively high, given that it reinvests in longer maturities, which tend to experience larger price fluctuations. The premium earned via the strategy can be considered compensation for assuming slightly longer duration and higher levels of volatility.
What has been sold to many investors, speculators and even desperate Fund Managers is using Bond ETFs to play the old “Roll Down the Yield Curve” Strategy. Here is how it works in case you are not familiar with the strategy.
ROLLING DOWN THE YIELD CURVE
The strategy of “rolling down the yield curve” targets investing in bonds at the steepest part of the curve. After a year or two, the bond is sold and the proceeds are reinvested back up the curve into higher-yielding, longer-maturity bonds. By selling the position well ahead of the actual maturity date, the strategy aims to capture the price increase that results when a bond’s yield drops as it “rolls down” the curve (that is, it moves closer to maturity). From there, the process repeats.
To illustrate, we can look at an example based on the yield curve in Exhibit 1. Consider an investor who buys a five-year Treasury paying a 1.5% coupon rate at par value. Fast forward two years, and that original five-year Treasury still yields 1.5%, but at that point it would have three years left to maturity. As can be seen in the yield-curve chart, the Treasury yield at a three-year maturity is 1.05%. Therefore, the price of the originally purchased five-year Treasury (which now also has a maturity of three years) would increase in order to ensure that its yield to maturity aligns with the current yield curve. (Note that, for the sake of simplicity, this example assumes that the yield curve remains stable over the observation period.)
If the Treasury paid a 1.5% coupon at a face value of $100, then after two years the price would have actually risen to $101.35 so that its yield to maturity matches the prevailing market. Recall that the three-year Treasury has a coupon yield of 1.05%. The original five-year Treasury in this example maintains its annual coupon yield of 1.5%, but then faces annual price declines of about $0.45 over the remaining three years until it matures. The yield to maturity balances out to 1.05% after factoring in those future price declines, which of course is equivalent to the yield to maturity that an investor could earn at that time from buying a newly issued three-year Treasury at par.
A buy-and-hold investor who bought at $100 would collect 1.5% per year in coupon payments and receive $100 at maturity. That comes out to a total of $7.50 in interest payments. The “roll down” strategy described in our example, on the other hand, could generate $10.90 in total returns during the same period thanks to locking in price gains and reinvesting into higher-yielding bonds.
YRA HARRIS WARNS “ALL HELL MAY BREAK LOOSE!”
Legendary trader Yra Harris who we recently interviewed at the Financial Repression Authority has been pounding the table for some time but just issued this warning:
The flattening of the yield curves in 2016 may lead to all hell breaking loose. WHAT DID I MEAN BY THIS? Grab a glass of scotch or Chuckie B., or some medicinal California and think about what I am going to say. (And, to paraphrase Danny Devito in the War of the Roses, when a person who charges $5,000 an hour offers free advice you might want to listen [humor intended].) In July 2012–the 24th to be exact–the U.S. 2/10 curve was flattening when it appeared that Europe was in a deep crisis. The two-year yields on EU sovereign debt were rapidly rising as the market feared about the viability of the EU and the EURO currency.
The European 2/10 curves were also flattening and when ECB President Mario Draghi issued his famous, NO TABOOS AND WE WILL DO WHATEVER IT TAKES to preserve the EU and the euro, the two-year yields began dropping and the 2/10 curves reversed course and began to steepen. The July 24 low was 117.25 positive slope. This was also the low made in January 2015 when the ECB and the SNB were busy revealing their plans about the EUR/CHF peg and the ECB‘s new QE policy (again, 117.25). As the year comes to an end, the flattening of the U.S. 2/10 curve continues and today we made an intraday low of 119.80. Now I will warn again that because of the lack of liquidity the last few weeks of the year prices can be easily manipulated and/or distorted.
BUT IF THE MARKETS RESUME FLATTENING IN RESPONSE TO GLOBAL ECONOMIC WEAKNESS AMID CHINESE SLOWING OR SOME GEO-POLITICAL EVENT ALL HELL WILL BREAK LOOSE. WHY? Last time the yield curves dramatically flattened in 2007 or 2012 in Europe the central banks, like John Mayall, HAD ROOM TO MOVE. When the U.S. curve inverted in early 2007, the rate was at 5.25% so the FED could swiftly cut rates in response to an incipient crisis. In Europe,the yields on the two-year notes of the so-called PIIGS were more than 7.0% and thus a dramatic drop in rates could be a positive signal to the markets.
WITH INTEREST RATES AT ZERO IN ALL THE DEVELOPED ECONOMIES WHAT WILL THE KEY POLICY MAKERS DO? A FLATTENING CURVE AT THIS JUNCTURE WOULD PUSH THE FED INTO NEW TERRITORY AND PUT FEAR INTO THE MARKETS.Thus, “ALL HELL WILL BREAK LOOSE” is an inference that the flattening of the curve at the zero bound will signal that the central banks have lost “control.” Will it be on the first close below 117.25? Most probably not but it is certainly an area for investors and traders to be very aware of. That was my point and it needed explanation beyond the allotted time of the Santelli spot. I await any questions or responses.
CONCLUSION
What Yra doesn’t say is we now have $2.2 Trillion of troubled High Yield bonds peddled to yield starved investors since the financial crisis, which matches 2/3’s of the $3.5 Trillion increase in the Federal Reserves balance sheet during the same period. Additionally, there are well north of $60 Trillion of Bond ETFs out there with anyone guess on how many fast money speculators are playing the “Rolling Down the Yield Curve” Strategy now up against the warning Morningstar so clearly disclaimed: “the roll down strategy will lose a lot of steam if the yield curve flattens more than expected.”
With serious liquidity issues clearly evident it should be interesting as a potential positioning scramble ensues. It somewhat reminds me of someone potentially shouting “FIRE” in a theater, except this times the theater doors will be barred and the only way out will be to have someone outside take your seat inside! ETF holders may find it easier to sell that old bridge over the East River in Brooklyn than get their money out of their ETFs.
Maybe what we will actually soon hear is someone shouting “CUSTODIAL RISK!”

One of the most disagreeable traits in a man is modesty.
He hesitates to commit himself.
“I don’t know…” he says. “I guess…” he begins. “Maybe,” he qualifies.
“Don’t you know anything?” his annoyed wife asks over dinner.
“Probably not,” he replies. “But I’m not sure.”
Uncertain Certainties
 Markets teach modesty…
Young investors can be confident. Old ones rarely are. Instead, they remember all the decisions that went wrong… and all the certainties that turned out to be uncertain.
For every dollar they made because they were sure a stock would rise… they remember the dollar they lost when it didn’t go up at all. And they can never forget the “friend” who offered them a “very special opportunity.”
A young investor finishes off every sentence with an emphatic period. An old one uses so many question marks, he wears the surface off the “?” on his keyboard.
And so… in the spirit of irritating humility… we question our own outlook….
What’s really going on, we wonder?
But first, a quick look at the markets.
A Fatal Flaw
As expected, trading was light yesterday.
U.S. stocks weren’t doing much. Analysts and investors weren’t much on the ball. Commentators and newscasters were mostly away from their desks.
Even the flow of reader feedback is slow.
So, back to our question marks…
We try to spend this quiet time between Christmas and New Year’s Day thinking more deeply, so let’s begin with an uncomfortable thought: Maybe we’re wrong.
Yes, but about what?
The money created post-1971 has a serious flaw: Unlike the gold-backed money that existed before then, this new money lacks natural limits.
The banks that control it can create almost as much as they want. The only constraints are imposed by banking regulators and the central bank – the Fed.
Bankers, being human, are prone to error… especially when it puts money in their own pockets.
They make profits by lending money out of thin air. The new system, as it evolved, allowed them to lend more than ever… including trillions of dollars that no one earned. And no one saved.
That’s why they no longer give out toaster ovens to people who open new accounts. They don’t care so much about depositors.
What they want are borrowers… and the entire industry has put its shoulder to the task of inventing ways to lend fictitious money to people who can’t pay it back.
Result?
About 45 times more debt today than when the new money system began.
And this huge buildup of debt has funded much of the world that we know today…
…the “financialization” of the U.S. economy.
…the rise of the “Deep State.”
…the fast development of China and $10 trillion of U.S. trade deficits. The run-up of the Dow from under 1,000 in 1982 to over 17,000 today. The loss of U.S. manufacturing… the decline of the middle class… and the enrichment of Wall Street.
All these things are consequences of a credit boom, made possible by the post-1971 “paper”-dollar monetary system.
Forever Blowing Bubbles
Good?
Bad?
We don’t know.
But our hypothesis is that, to continue living in the style to which we’ve become accustomed, this credit bubble has to expand further.
The economy that we now take for granted is one that depends on it. Credit has allowed people to spend more than they earn – year after year.
Median household earnings – when adjusted for inflation – are down so far this century. The typical man is less likely to have a full-time job than ever before in history.
Without more credit, the whole system shrivels up like a desiccated slug. But here’s the rub: Debt cannot grow forever.
The problem was discussed long ago by Austrian School economists. They maintained that a boom driven by “credit in excess of real savings” was phony… that it was merely taking resources from the future… and that eventually there would be an equal and opposite bust.
Loans must be repaid. When they are, the money that came into existence when it was borrowed goes back whence it came. The boom turns into a bust.
We’re waiting for the bust. We saw it coming in 2007, as debt levels in the housing sector reached a peak.
And we anticipated the Fed’s reaction to it – more EZ credit.
Student debt, auto debt, energy debt, corporate debt, stock buybacks, mergers and acquisitions – the economy staggers under the weight of it all.
And now, we’re still waiting, modestly wondering how much more the system can take.
Are we wrong?
To be continued…
Regards,
Bill
Market Insight
by Chris Lowe
Investors spent most of 2015 preparing for “lift-off” on interest rates.
This month, the Fed finally raised short-term rates by a quarter of a percentage point to 0.5%.
But as today’s chart shows, the yield on the 10-year Treasury note is almost exactly where it was at the start of the year – at just over 2%.
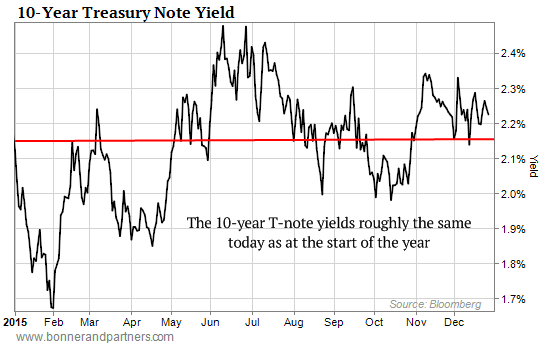
The approximately 2% yield on the T-Note represents the interest the federal government pays for borrowing money over 10 years.
It’s also a key benchmark for other important lending rates, such as mortgage rates.
So much for the end of ultra-easy money…
Further Reading: As Bill’s research shows, the system is already saddled with nearly $60 trillion of debt. So if we get “the equal and opposite bust” the Austrians warned about, it’ll be the greatest economic collapse in history.
In his latest investor presentation, Bill examines how we got to this dangerous point, what’s going to happen next, and how you can protect yourself – and even prosper – during the inevitable financial meltdown. Watch here now.

-
I know Mike is a very solid investor and respect his opinions very much. So if he says pay attention to this or that - I will.
~ Dale G.
-
I've started managing my own investments so view Michael's site as a one-stop shop from which to get information and perspectives.
~ Dave E.
-
Michael offers easy reading, honest, common sense information that anyone can use in a practical manner.
~ der_al.
-
A sane voice in a scrambled investment world.
~ Ed R.
Inside Edge Pro Contributors

Greg Weldon

Josef Schachter

Tyler Bollhorn

Ryan Irvine

Paul Beattie

Martin Straith

Patrick Ceresna

Mark Leibovit

James Thorne

Victor Adair