
Bonds & Interest Rates
We have looked at plenty enough evidence in recent weeks that a crash is looming for US markets, and now we are going to take a look at another important piece of evidence that we haven’t previously considered – the Junk Bond market.
When confidence deteriorates Junk Bonds get sold off. A reason for this is that Junk Bond Holders are low on the list of creditors who can expect to be paid off in the event of corporate default, hence the name. They yield more because they carry more risk, so when risk threatens to rise or rises, savvy holders want out.
Thus it is interesting to see that Junk Bonds have just fallen to a 3-year low. This is a leading indicator for the market and it means trouble. We can see what has happened on the charts for the SPDR Barclays High Yield Bond ETF, code JNK, shown below. If you can’t tell that this is a Junk Bond ETF from the name, you sure can from the code. They have gone into a persistent downtrend from the start of June as we can see on the 1-year chart, which has already taken them to a 3-year low, as can be seen on the 8-year chart. We are using Bigcharts charts here because Stockcharts appear to be carrying inaccurate data, and two 1-year charts are shown, with one showing volume and On-balance Volume, and the other showing a comparison with the S&P500 index, and two 8-year charts.


Almost everyone I talk to thinks the European sovereign-debt crisis has passed. They say Greece’s bailout fixed the problem. Europe is on the mend, they say.
But as far as I’m concerned, nothing could be further from the truth.
First, severe austerity measures continue to this day and they are causing debt-to-GDP ratios to worsen.
The proof is in the numbers. Before the Greek crisis flared up, debt-to-GDP in Greece stood at 113%. Today, Greece’s debt-to-GDP stands at a tad north of a whopping 177%.
In Spain, pre-crisis debt stood at 40% of GDP. Today it’s more than 97%.
In Italy, it was 106%. Now it stands at 132%.
 In France, it was 68%. Now it’s 95%.
Even Germany’s debt-to-GDP is worsening, leaping from almost 67% in 2008 to almost 75% today.
In each and every case, debt-to-GDP is worse than it was at the beginning of the crisis — and the austerity measures are literally causing the entire European continent to implode.
Second, austerity and climbing debt levels are hollowing out Europe’s economic growth.
According to Eurostat, Europe’s GDP in the second quarter of 2015 slowed to 0.3%, leaving output 1.2% higher than a year ago. The figure disappointed all 19 economists polled who were expecting 0.4% growth.
France’s economy is slumping. GDP growth of 0.2% was expected, but growth came in at 0.0%.
Italy’s GDP came in at 0.2% compared with 0.3% in the first quarter, leaving output only 0.5% higher than a year ago.
And Germany’s economy, the only engine left holding the feeble union together, expanded by 0.4%, lower than the consensus forecast of 0.5%.
All of this continues to create …
Third, some of the worst unemployment we’ve seen in modern times.
Each and every one of these countries is in hock way over its head. And each and every one of them is in the depths of a nightmare caused by austerity measures.
Unemployment in Greece is at 25.6%. Spain: 22.5%. Portugal: 12.4%. Belgium: 8.6%. Italy: 12.7%.
Unemployment among youth (under 25) is still off the charts. In June 2015, 3.181 million young persons were unemployed in the euro area, an unemployment rate of 22.5%.
The lowest rates were observed in Germany (7.1%), Malta (10%), Estonia (10.1% in May 2015), Denmark and Austria (both 10.3%).
And the highest rates were seen in Greece (53.2%), Spain (49.2%), Italy (44.2%) and Croatia (43.1% in the second quarter 2015).
Corporate and personal bankruptcies are surging. Social discontent is on the rise again. And tensions between countries within Europe are higher than ever.
Pretty picture? Hardly. It’s the ugliest economic picture for Europe since the 1930s, when 17 European countries went belly up, sending hundreds of billions of dollars’ worth of francs, marks, lira, and more flooding into the U.S.
That, in turn, sent the U.S. stock markets exploding higher. It sent the dollar and gold simultaneously into a moon shot as well. And it’s all about to happen again.
Fourth, deflation is picking up momentum.
With austerity measures squashing growth all over Europe, deflation is starting to run rampant.
According to the latest data, prices eurozone producers charged for their goods fell a whopping 2.2% at the August data release.
In short, nothing, and I mean nothing, has been solved in Europe. The crisis will soon escalate with a vengeance.
When (not if) Europe’s economy roils again:
First, you’re going to see trillions more euros stampede for the exits. That’s going to send several large European financial institutions down the tubes.
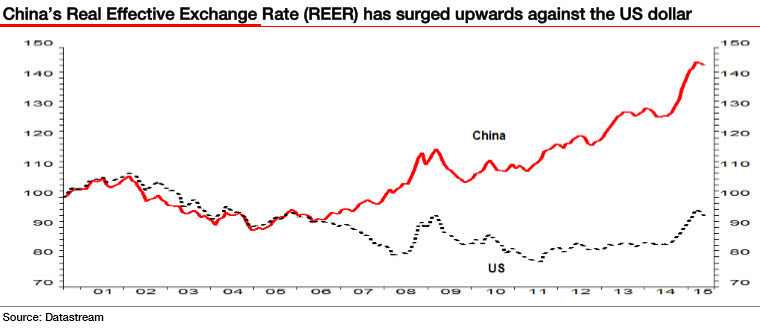
Second, that flood of capital is going to send the U.S. dollar again into rally mode. Just like it did in the early 1930s when Europe last went bankrupt.
Third, after a correction, it’s also going to send our stock markets roaring higher. Just like it did between 1932 and 1937 when the Dow Jones Industrials soared 387% as Europe went under.
Fourth, it’s going to give you multiple profit opportunities to potentially make more money than you ever dreamed of. In stocks. In commodities. In the dollar. And in gold and silver.
My suggestions right now are …
A. Keep your eyes on Europe. And keep most of your liquid funds in cash, ready to be deployed on a moment’s notice, but as safe as can be right now.
The best way, in my opinion: A short-term Treasury-only fund in the U.S., or the equivalent.
B. Earmark a portion of your cash for speculation. Not too much, and not too little. I recommend 25% of your total investable funds. Funds that you do not need for anything else.
Finally, don’t let anyone kid you. Europe’s problems are simply the beginning of a great sovereign-debt crisis that will soon spread around the globe, creating some of the worst times we have ever seen …
And some of the biggest threats to your wealth, ever. But along with this crisis will also come some of the greatest speculative profit opportunities, ever …
And you should do everything in your power to take advantage of them. I know I will.
Best wishes,
Larry
 You wouldn’t know by looking at the US Treasury market, which remained relatively sanguine this week, with only a little panic buying on Tuesday. So 10-year Treasuries ended the week near where they’d started it. But at the other end of the spectrum, the riskiest portion of the junk bond market just blew up spectacularly.

 Let’s have a look at a long-term perspective on Treasury yields. The chart here shows the 10-Year Constant Maturity yield since 1962 along with the Federal Funds Rate (FFR) and inflation. The range has been astonishing. The stagflation that set in after the 1973 Oil Embargo was finally ended after Paul Volcker raised the FFR to 20.06%.

Make no mistake, warns SocGen’s Albert Edwards, this is the start of something big, something ugly. For while the west has been heaving a sigh of relief over the past few months that deflation pressures have abated somewhat – especially at the core level – we have been emphasising that deflation has only been intensifying in Asia and that like any puss-filled boil, this deflationary pressure would soon need to be lanced……continue reading HERE

-
I know Mike is a very solid investor and respect his opinions very much. So if he says pay attention to this or that - I will.
~ Dale G.
-
I've started managing my own investments so view Michael's site as a one-stop shop from which to get information and perspectives.
~ Dave E.
-
Michael offers easy reading, honest, common sense information that anyone can use in a practical manner.
~ der_al.
-
A sane voice in a scrambled investment world.
~ Ed R.
Inside Edge Pro Contributors

Greg Weldon

Josef Schachter

Tyler Bollhorn

Ryan Irvine

Paul Beattie

Martin Straith

Patrick Ceresna

Mark Leibovit

James Thorne

Victor Adair