
Bonds & Interest Rates
 …..Devalues Yuan by Record Amount, Vows to “Severely Punish” Capital Flight
Tuesday morning, the People’s Bank of China pulled the ripcord.
In a big way…..read more HERE

 Over the past few years observing changes in Federal Reserve interest rate policy has been a little like watching paint dry or grass grow…only not as exciting. That’s because the Fed has not changed its benchmark Fed Funds rate since 2008 (Federal Reserve, FOMC). So with nothing else to talk about, Fed observers have focused on the minute changes in language that are included in Fed Policy statements. The minuscule revision in the July statement was the inclusion of the word “additional” to the “labor market improvements” that the Fed wants to see before finally pulling the trigger on its long-awaited rate increases. That should lead to a discussion of what kind of “additional” improvements those could be.
As the unemployment rate has crept steadily downward, the participation rate has moved down with it. In fact, more people have dropped out of the labor force in recent years than have actually found jobs. In June, a staggering 640,000 Americans gave up on job hunting (Bureau of Labor Statistics, 7/2/15), pushing the participation rate down to 62.6%, the lowest figure since 1977 (FRED, St. Louis Fed). And contrary to the spin put on by the White House Council of Economic Advisers, these are not retiring baby boomers. Older people are actually staying in the workforce longer. Rather, these are prime age workers who have simply given up looking for work.

 I wrote a story about poor Clarence who retired in 1979, and even poorer Larry who retired last year. I created these characters to challenge the notion of calculating a real interest rate by subtracting inflation. The idea is that the decline of a currency can be measured by the rate of price increases. This price-centric view leads to the concept of purchasing power—the amount of stuff that a dollar can buy. It’s the flip side of prices. When prices rise, purchasing power falls.
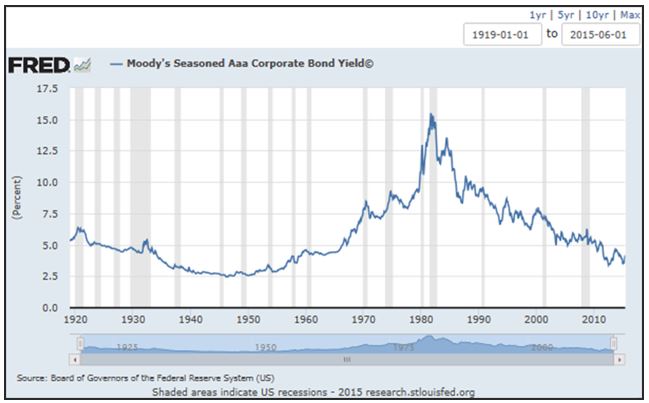
Recall in the story, Clarence retired in 1979. At the time, inflation was running at 14% but he could only get 11% interest. Real interest was -3%, and Clarence had a problem. He was losing his purchasing power.
Suppose Clarence bought gold. The purchasing power of gold held steady for the rest of his life (see this chart of oil priced in gold). Gold does solve this problem. However, gold has no yield. Clarence is only jumping out of the frying pan and into the fire. Sure, he escapes dollar debasement, but then he gets zero interest.
Let’s look at how zero interest impacts Larry. He makes $25/month on his million dollars. Obviously he can’t live on that. So he gives up his nest egg, for eggs. For a year, he feasts on omelets. Since inflation was slightly negative, the same swap in 2015 nets him the same plus a few additional quiches.
Through the lens of purchasing power, we don’t focus on the liquidation of Larry’s wealth. We ignore—or take it for granted—that he’s trading his life savings for bread. We only ask how many loaves he got.
If you had a farm, would you consider trading it away, to feed your family for a year? I hope not. A farm should grow food forever. Its true worth is its crop yield, not the pile of bacon from a one-time deal.
How perverse is that? It’s nothing more than what zero interest is forcing Larry to do.
A dollar still buys about as much as it did last year. Larry’s purchasing power didn’t change much. However, debasement continues to wreak its destruction. Steady purchasing power does not mean that the dollar is holding its value.
It means that prices are wholly inadequate for measuring monetary decay.
Our monetary disaster becomes clear when we look at the collapse in yield purchasing power. This new concept does not tell you how many groceries you can get by liquidating your capital. It tells how much you can buy with the return on it.
In 1979, Clarence’s $100,000 savings earned enough to support his middle class lifestyle. In 2014, Larry’s million dollars didn’t earn enough to pay his phone bill. To live in the middle class, Larry would need over a hundred million bucks. That’s a pitiful income to make on such a massive pile of cash. It reveals a hyperinflation in the price of capital, which has gone up 1100X in 35 years.
It also shows that the productivity of capital is collapsing. Back in Clarence’s day, businesses earned a high return on capital. It was high enough for Clarence to get 11% interest in a short-term CD. Unfortunately, the dollar rot is in the advanced stage now. There is scant interest to be earned. Return on capital is low, and so borrowers can’t pay much.
Retirees suffer first, because they can’t earn wages. Normally they would depend on interest, but now they’re forced to live like the Prodigal Son. They consume their wealth, leave nothing for the next generation, and hope they don’t live too long. Zero interest rates has reversed the tradition of centuries of capital accumulation.
Purchasing power may look fine, but yield purchasing power shows the true picture of monetary collapse.
This article is from Keith Weiner’s weekly column, called The Gold Standard, at the Swiss National Bank and Swiss Franc Blog SNBCHF.com.

 The primary attractions supporting investing in bonds or other fixed income instruments have traditionally been high income and safety. People invest their principal in bonds and receive a stated interest rate (coupon) over the life of the bond and are given the promise of having their principal returned at maturity. Under normal times, bonds would typically pay a higher rate of interest than the dividend rate on stocks. Consequently, bonds have acquired the reputation as low risk and high income instruments.
However, risk is a multifaceted concept. The risk of losing all your money is one of the investor’s greatest fears. Virtually all high-quality bonds eliminate this loss of principal risk. But there are additional risks…. CLICK HERE to read the complete article

 Last week, Europe hurriedly offered Greece a new bailout deal … the Greek parliament rushed to pass new Draconian reform laws … the German parliament did the same … and the ECB promptly dished out more money to keep the country’s banks afloat.
Nearly everyone — lenders, borrowers and politicians — did exactly what they vowed never to do.
Why?
Most people think it’s because they want to defend the euro at all costs. True.
But there’s more to all this than meets the eye: There are hidden time bombs that are driving all players down the same old path of more bailouts and debt pile-ups.
These hidden time bombs have a name: Derivatives.
And they have a number: $630.1 trillion.
That’s right. According to the Bank of International Statistics, at yearend last year, the world’s total notional value of derivatives traded over the counter (outside of organized exchanges) was $630.1 trillion.
That’s about eight times the gross domestic product of the entire planet.
It’s nearly 47 times the total amount of mortgages outstanding in the United States.
And it’s over 34 times greater than the already-huge U.S. national debt.
So here’s the hidden timebomb story in a nutshell:
1. Derivatives are high-risk bets that are extremely vulnerable to unique events like a collapse of the euro.
2. Major European banks, especially in France, the UK and Germany, hold huge amounts.
3. Because they’re so vulnerable, they feared a Greek exit from the euro could have hit them much like the failure of Lehman Brothers struck U.S. and European banks in 2008.
4. There was no way in heck they’d be willing to take that risk. So they pushed forward with a Greek rescue even though it was totally contrary to everything they believed and even in direct conflict with everything many were saying in public.
Remember: Derivatives are side bets made mostly with borrowed money. They are bets on foreign currencies (like the euro), bets on interest rates, bets on corporate failures, even bets on bets. The bets are placed by banks with each other, banks with brokerage firms, brokers with hedge funds, and hedge funds with banks, just to name a few.
They are often high-risk. And as I just showed you, they’re huge.
Defenders of derivatives claim that these giant numbers overstate the risk. And indeed, most professional players do hedge their bets. But that’s just one side of the risk.
More Dangerous Than Any Casino
To better understand how this works, consider a gambler who goes to Las Vegas. He wants to try his luck on the roulette wheel, but he also wants to play it safe.
So, instead of betting on a few random numbers, he places some bets on red, some on black, or some on even and some on odd. He rarely wins more than a fraction of what he’s betting, but he rarely loses more than a fraction either. That’s similar to what banks like Citigroup or JPMorgan Chase have done with derivatives, except for three key differences:
Difference #1. They don’t bet against the house. In fact, there is no house to bet against (which is the key to the problem). Instead, they bet against the equivalent of other players around the table.
Difference #2. Although they do balance their bets, they do not necessarily do so with the same player. So going back to the roulette metaphor, if a major bank bets on red against one player, it may bet on black against another player. Overall, its bets may be balanced and hedged. But with each individual betting partner, they’re not balanced at all.
Difference #3. The amounts are huge — thousands of times larger than all the casinos of the world put together.
Plus there’s one similarity with the roulette wheel that implies the greatest risk of all: What if the ball falls on green — the zero or double zero?
Or, in the parlance of financial risk analysis, what if financial institutions are confronted with a “Black Swan” event — one that strikes from out of the blue, that none of the participants anticipated when they originally placed their bets.
In sum, here are the urgent questions that, despite much debate, remain unanswered:
1. What happens if there is an unexpected collapse? (Two prime examples: The Lehman Brothers failure. Or a sudden exit from the euro by Greece and other Eurozone countries.)
2. What happens if that collapse is so severe — or the institutions already so weakened — it drives some of the big players into bankruptcy?
3. Most important, what happens if these bankrupt players can’t pay up on their gambling debts?
The authorities often say that these questions are merely hypothetical and should never be considered seriously. Yet each of these three supposedly “hypothetical” events took place in last debt crisis:
First, we witnessed the unexpected collapse of the biggest credit market in the world’s largest economy — the U.S. mortgage market.
Second, we witnessed the bankruptcy or near-bankruptcy of five key players in the derivatives market — Bear Stearns, Lehman Brothers, Merrill Lynch, Wachovia Bank and Citigroup.
Third, we also got the first answers to the last question in the form of a single statement that hit the international wire services on October 11, 2008 (italics are mine.):
“Intensifying solvency concerns about a number of the largest U.S.-based and European financial institutions have pushed the global financial system to the brink of systemic meltdown.”
This statement was not the random rant of a gloom-and-doomer on the fringe of society. It was the serious, objective assessment announced at a Washington, D.C., press conference by the managing director of the International Monetary Fund (IMF).
He was the highest world authority on this matter. He saw the dangers. And he was not joking. But neither he nor anyone else seemed ready to answer the most burning, urgent questions it raised for millions of savers:
What is a “Systemic Meltdown”?
And How is it Possible?
Here are the answers:
Definition: A systemic meltdown is a chain reaction of failures, forcing a temporary global shutdown of banks and financial markets around the world. Essentially, the global economy comes to a screeching halt, hopefully for just a short period of time.
Likelihood: Unknown. However, the unmistakable implication of the IMF’s statement is that, by October 2008, so many of the world’s largest banks were so close to bankruptcy, the entire banking system was vulnerable to this kind of massive collapse.
And the unmistakable nightmare of European officials today is that the bankruptcy of an entire member nation — Greece — could set off a similar meltdown.
The most immediate cause: None other than the same derivatives I’m talking about here.
But despite abundant talk of reforms, little has changed since 2008. Indeed …
* In the United States, under lobbying pressure from large Wall Street banks, one of the most critical reforms was postponed until late 2017.
* In Europe, even talk of reform has been, at best, subdued by complacency and sidelined by the Greek crisis.
Result: We still have a global banking system that remains, as before, a large, global gambling network without a mechanism to handle failures.
Ironically, even the Mafia knows how to better handle gambling networks to avert systemic meltdowns.
In the numbers racket, for example, players place their bets through a bookie, who in turn is part of an intricate network of bookies. Most of the time, the system works. But if just one big player fails to pay bookie A, that bookie might be forced to renege on bookie B, who, in turn, stiffs bookie C, causing a chain reaction of payment failures.
The bookies go bankrupt. The losers lose. And even the winners get nothing. Worst of all, players counting on winnings from one side of their bets to cover losses in offsetting bets are also wiped out. The whole network crumbles — a systemic meltdown.
To avert this kind of a disaster, the Mafia henchmen know exactly what they have to do, and they do it swiftly: If a gambler fails to pay once, he could find himself with broken bones in a dark alley; twice, and he could wind up in cement boots at the bottom of the East River.
Established stock and commodity exchanges, like the New York Stock Exchange, the Chicago Board of Trade, or the London Stock Exchange, also have strong enforcement mechanisms. Unlike the Mafia, of course, the trading is entirely legal. But, like the Mafia, they fully recognize the dangers of a meltdown and have strict procedures to counter them.
When you want to purchase 100 shares of Microsoft, for example, you never buy directly from the seller. You must always go through a brokerage firm, which, in turn, is a member in good standing of the exchange.
The brokerage firm must keep close tabs on all its customers, and the exchanges keep close track of all their member firms. So if you can’t come up with the money to pay for your shares or put up the needed collateral for broker loans, the broker is required to promptly liquidate your securities, literally kicking you out of the game.
And if the brokerage firm as a whole runs into financial trouble, it meets a similar fate with the exchange — very, very swiftly!
Here’s the key: For the most part, the global derivatives market has no brokerage, no exchange, and no equivalent enforcement mechanism.
In fact, 100% of the $630.1 trillion figure I cited is traded outside of a formal exchange. The market for other derivatives, like options and futures that are traded on organized exchanges is a much smaller — only $64.8 trillion.
Sure, after the 2008 debt crisis, there was a lot of talk about moving some of the derivatives to regulated exchanges or equivalent; and some initial steps were taken in that direction.
But the proportion of regulated derivatives has actually gone down when compared to the period prior to the debt crisis:
In the U.S., for example, U.S. Comptroller of the Currency (OCC) reports that, on June 30, 2007, 6.5% of derivatives held by U.S. banks were traded under regulated exchanges. But here we are, nearly eight years later, and only 4.5% are traded on exchanges. They have obviously not fixed the problem. It’s actually gotten worse.
Moreover, the data compiled by the OCC and BIS indicate that the bets are still so large and the gambling is still so far beyond the reach of regulators, all it would take is the bankruptcy of a relatively less important player — such as another Lehman Brothers or a small sovereign country like Greece — to throw the world’s credit markets into paralysis.
That’s why the world’s highest banking officials were so panicked when Lehman Brothers failed in the fall of 2008. And that’s also the big unspoken reason why Germany and every other country in the E.U. are rushing to bail out Greece.
Which U.S. banks are currently the most exposed? Based on first-quarter 2015 data compiled by the OCC, I can give you two very specific answers:
The first answer is in terms of which banks hold the most derivatives outside of any formal exchange. (See pdf page 26 of the OCC report.)
- Bank of America NA holds a total of $36.7 trillion in derivative bets, with 93.8% traded outside of any exchange.
- Goldman Sachs Bank USA holds a total of $46.8 trillion in derivatives, with 94.4% traded outside of an exchange.
- Citibank NA, the primary banking unit of Citigroup, has $56.3 trillion in derivative bets, with 97.5% of those bets outside the purview of any exchange — all direct, one-on-one bets with Citibank’s trading partners.
- JPMorgan Chase is, by far, the biggest of them all, towering over the U.S. derivatives market with nearly double Bank of America’s book of bets — $63.7 trillion worth, with 95.6% traded outside of any exchange.
Which U.S. banks have the biggest exposure to any failures by their many gambling buddies (counterparties)? That takes me to …
The second answer — about concentration of risk. Just these top four derivatives players — B of A, Goldman, Citi and JPMorgan — control nearly $203.5 trillion, or 92% of all derivatives held in the U.S. banking system.
And the largest 25 U.S. banks control 99.8%. Can you believe that? It means that all told, the thousands of other regional, mid-sized and small banks in this country control a meager one-fifth of one percent of the derivatives.
This is an oligopoly unlike any other in the financial world — one that ties the fate of the U.S. economy to these firms’ stability far beyond anything ever witnessed in prior centuries.
Just four banks! Making bets of unknown nature and risk! Involving a notional dollar amount equivalent to nearly 14 years of the total production of the entire U.S. economy!
In contrast, Lehman Brothers, whose failure caused such a large earthquake in the global financial system, was actually smaller by comparison — with “only” $7.1 trillion in derivatives.
And if you think that’s bad, remember that the derivative exposure of European banks is even greater.
The Consequences
For now, this means that some the world’s smartest political and financial leaders will continue to make some of history’s most stupid mistakes — printing more money, bailing out more sick debtors and kicking the can down the road for as long as they can get away with it.
It also means that the debt crisis will be perpetuated, continually resurfacing and continually driving flight capital from the world’s highest risk regions to countries perceived as safer havens, especially the United States.
Most important, however, the moral of this story for investors is extreme caution. Invest only in the very best and dump the rest. Keep plenty of cash on hand. And stay alert to the dangers.
Good luck and God bless!
Martin
About Martin D. Weiss Ph.D
Martin D. Weiss is one of the nation’s leading providers of a wide range of investment information. He is chairman of The Weiss Group, Inc. which consists of four separate corporations, including Weiss Research, Inc., the publisher of the Safe Money. This investment news is brought to you by Money and Markets. Money and Markets is a free daily investment newsletter from Martin D. Weiss and Weiss Research analysts offering the latest investing news and financial insights for the stock market, including tips and advice on investing in gold, energy and oil. Dr. Weiss is a leader in the fields of investing, interest rates, financial safety and economic forecasting. To view archives or subscribe, visit http://www.moneyandmarkets.com. – See more at: http://www.swingtradingdaily.com/2015/07/20/hidden-time-bombs-behind-greece-bailout/?utm_source=feedburner&utm_medium=feed&utm_campaign=Feed%3A+swingtradingdaily%2FhfnE+%28Swing+Trading+%C2%BB+Stocks%29#sthash.OM7iCoKA.dpuf


-
I know Mike is a very solid investor and respect his opinions very much. So if he says pay attention to this or that - I will.
~ Dale G.
-
I've started managing my own investments so view Michael's site as a one-stop shop from which to get information and perspectives.
~ Dave E.
-
Michael offers easy reading, honest, common sense information that anyone can use in a practical manner.
~ der_al.
-
A sane voice in a scrambled investment world.
~ Ed R.
Inside Edge Pro Contributors

Greg Weldon

Josef Schachter

Tyler Bollhorn

Ryan Irvine

Paul Beattie

Martin Straith

Patrick Ceresna

Mark Leibovit

James Thorne

Victor Adair