
Bonds & Interest Rates
 The Federal Reserve has kept its benchmark interest rate near zero for years in its effort to stimulate job growth and stoke inflation in the post-financial crisis world.
But with job growth looking healthy and some signs that inflation could soon heat up, Fed Chair Janet Yellen and her colleagues have been preparing the markets and its participants for tighter monetary policy via an initial rate hike.
“Given the importance of getting the timing right, the FOMC needs to be absolutely sure that tightening is the right thing to do,” Nomura’s Richard Koo writes. “On this point, three of the members on the rate-setting committee have already argued that the Fed should tighten, while Chair Yellen and the rest of the members believe the start of this long 375bp journey is similar to a rocket launch in that all conditions need to be favorable.”
Koo thinks that it’s noteworthy the way Fed members are characterizing.
 RBCCM
RBCCM
“Interestingly, these people are referring to the first rate hike as “lift-off,” which is the term used to describe the moment the rocket leaves its launching pad,” Koo wrote. “This is an indication of how careful the Fed will have to be when pushing the button on a rate increase.”
Koo argues it’s important that this path to monetary policy normalization be steady as she goes, or we could see trouble.
“Once the Fed begins its mechanical tightening process, stopping before the goal is reached could upset the markets,” he wrote.
Currently, most economists believe the first rate hike will come June of this year. But there are plenty of economists who would argue that the Fed should put this first move off until later this year or even early 2016.
….more from BusinessInsider:

 Commentary & Analysis
Yellen wolf? And betting on Bligh?
I read an interesting article on Bloomberg.com concerning the performance at PIMCO now that Bill “Captain Bligh” Gross has left the ship. According to the author, the new team now at the wheel has outperformed their old leader by concentrating its bets on the middle of the yield curve, under the expectation the Fed will indeed do the dirty deed—hike rates in June. But the old captain, now at the helm at Janus (not yet rearranging the deck chairs), has positioned into longer term maturities expecting the Fed to stand pat for longer than now expected…
Please click here to view the issue
——-
Free Three-Week Trial to Black Swan Capital currency services:

In the movies, an edgy musical score is an effective tool that warns the audience something really bad is about to happen. Like the shrill screech in Psycho, certain sound effects forebode impending doom. In like manner, economics also has a similar warning sign of imminent market chaos. This omen is called the inverted yield curve. And it’s no coincidence that the last seven recessions have been preceded by this ominous predictor of economic and stock market disaster.
The yield curve graph depicts the slope of sovereign bond yields across all maturities. When investors desire to purchase longer-dated maturities, they typically demand a higher yield to compensate for inflation risks that tend to increase over time. Therefore, under normal circumstances, longer-term bonds yield more than their short-term counterparts. Typically, the yield on 30-year Treasury bonds is three percentage points (300 basis points) above the yield on three-month Treasury bills. When the yield curve steepens from that usual spread it means long-term bond holders believe the rate of inflation will increase sharply in the future.
At the other end of the spectrum we have the inverted yield curve. This occurs when the Fed Funds Rate and short-term U.S. Treasuries offer higher yields than longer-dated issues. The signal here is that investors anticipate an environment of sharply slowing economic growth, deflation and economic turmoil.
How This Played Out During The Past Two Recessions?
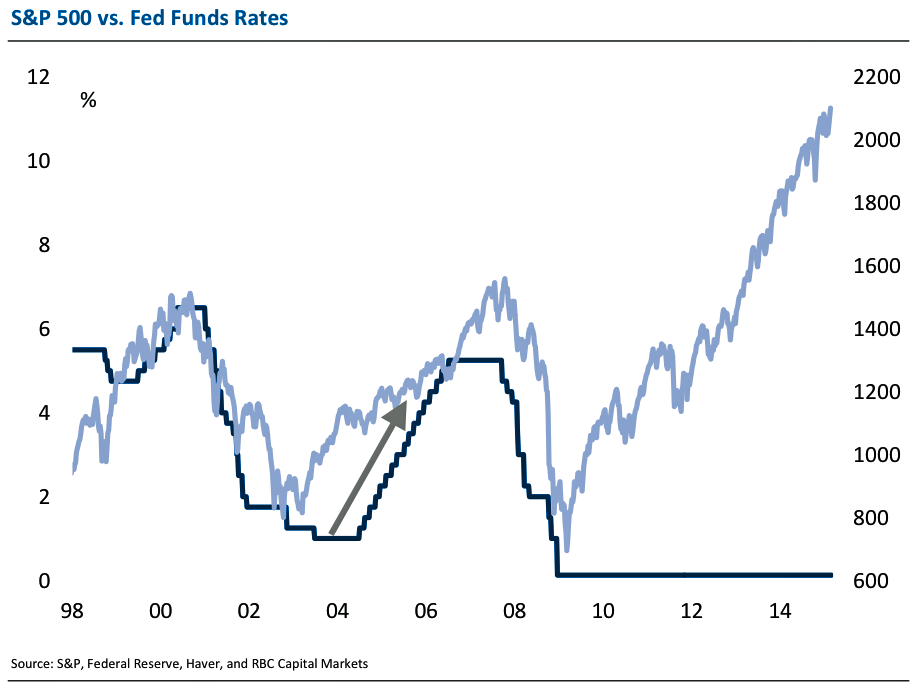
By the late spring of 2000, the rate on the 10 year note was lower than the Fed funds rate; thus officially inverting the yield curve. The Federal Reserve raised the Fed funds rate 25 basis points on March 21st from 5.75, to 6.0%. Afterwards, the Fed ended its rate hike campaign in May of that year with a 50 basis point rate increase to 6.5%, while the Ten-year Note traded below 6.0% by June. After this, the S&P 500, which was not a part of the tech bubble, peaked in July of 2000 and dropped 40% by September of 2002.
Likewise, in June 2006 the Fed ended its multi-year cycle of rate increases, taking the Funds Rate up 25 basis points to 5.25%, while the 10-year Note yielded around 5.0% during that same timeframe. The yield curve officially inverted for the second time that decade — investors once again heard the ominous music playing. The backward yield curve first caused the massive housing bubble to rollover in the summer of 2006. And, since the yield curve remained inverted for over one year, the equity market quickly followed the collapsing real estate market. The S&P 500 plummeted 50% from July of 2007, to March 2009.
Today the 10 year note is trading around 2.25% and the Fed Funds rate is in the 0-25 basis point range. During the Fed’s previous rate hike campaign, it had to move short-term rates up 400+ basis points before the yield curve became inverted. However, this time around the Fed will only have to increase the Fed Funds Rate half that amount before the yield curve will become inverted. And it may take even less than that, as the economy is already experiencing anemic growth and disinflation — which will put downward pressure on long-term rates. In addition, interest rates on foreign sovereign debt are well below those in the United States, which will push domestic rates down even further.
Therefore, this time around the yield curve will invert at a much lower level than at any other time in history. What’s more, the Fed has historically raised rates in order to combat a rising rate of inflation, a weakening U.S. dollar and rapid GDP growth. Now, it will be raising rates in the midst of low inflation, a soaring Greenback and anemic economic growth. And, the Fed won’t have to make many rate hikes before the yield curve inverts.
So Why Will The Fed Raise Rates?
The Fed has drawn a Maginot line with its use of the unemployment rate as the main indication of when to raise rates. The Fed is relying on an indicator for when to raise rates that is painting an inaccurate picture of growth and inflation. The U-3 unemployment rate, which is now sitting at 5.5%, isn’t taking into account the unusual amount of part-time and discouraged workers. That U-6 unemployment rate, which includes those partially and fully separated from the workforce, is currently 11%. That figure is two full percentage points higher than where it was the last time the U-3 rate was at this level, which was during the epicenter of the financial crisis.
But the Fed’s Keynesian illogic dictates that a low unemployment rate is the very cause of all that is inflationary, despite alternative measures of labor slack. Therefore, in Pavlovian fashion, it will feel compelled to start raising rates in the next few months.
Most importantly, it will be raising short-term rates when the long end of the yield curve has been artificially manipulated to a record low level. Our hapless central bank may be venturing down the short and dangerous path to an inverted yield curve. But at the same time, economic growth and inflation are decelerating.
Interest Rate Obsession
Foreign central banks will also soon have to abandon their reckless policies of QE to infinity due to its futile effect on GDP growth. Likewise, since sovereign yields are near zero percent in Japan and Europe, it will take just a few basis points in rate hikes to send the entire developed world into an inverted yield curve situation for the first time in global economic history. This is what lies ahead for global investors as central banks begin to move away from the massive distortion of asset prices for the last 7 years. Unfortunately, in the aftermath of this next deflationary collapse, global governments will embark on an unprecedented economic experiment that will involve the further erosion of free markets as part of their effort to reflate asset prices.
In the movies, when a character is unaware of the ominous warning signs that the director has provided the audience, it usually leads to their imminent demise. Ms. Yellen and company may be unaware how important an inverted yield curve is to the banking system and money supply growth. But investors should not let the ignorance of central banks lead to the demise of their wealth.
 About Michael Pento
Michael Pento produces the weekly podcast “The Mid-week Reality Check”, is the President and Founder of Pento Portfolio Strategies and Author of the book “The Coming Bond Market Collapse.”
I invite you to inspect the following chart of 10-year interest rates in the US.
If you don’t have a lot of experience with these things, let me clue you in: This is a very scary-looking chart. It’s a classic head-and-shoulders bottom in yields.

If you’re one of those people who’s scornful of technical analysis, don’t be. Now, I don’t pay much attention to complicated stuff like Elliott Wave or Gann Angles, but there are some very basic technical formations that work reliably most of the time.
I had the good fortune of taking out a mortgage when 10-year rates were at 1.9%, which goes to show that the only
time you get to top-tick stuff is by accident.
Now, this is actually not the low in yields. 10-year yields got to 1.4% a few years ago.

Of course, interest rates are even lower in Europe. Take Germany, for example:

I think that these interest rates (which are at 700-year lows in Europe) signify a bubble. Other people don’t, though—they point to x, y, and z as signs of deflation.
I’m very weary of the inflation/deflation argument. A lot of people lost a lot of money betting on inflation when there were obvious signs of inflation (QE). And I fear that a lot of people will lose a lot of money betting on deflation when there are obvious signs of deflation.
I’m a trader at heart, and I try not to get too attached to my views. I pay attention to price. And right now, the price action is telling me that the bond market might be in trouble.
Central Banks Buy High and Sell Low
The first thing you need to know about central banks is that they are the worst traders in the world. The worst.
Probably the most famous example in the modern era was the Bank of England under Gordon Brown’s leadership puking its gold holdings—on the absolute lows, between 1999 and 2002. The idea was they had this gold sitting there not generating any yield, so why not sell the gold and buy paper that would generate some yield?
Whoops…

A less famous example of bad trading by public officials would be the US Treasury’s decision to issue floating-rate debt. Now, if the government has floating-rate liabilities, it should want interest rates to stay low, right?
Whoops…

The all-time lows in rates. To the exact day.
So with all this in mind, don’t you think it’s interesting that the ECB is going to buy European debt—at 700-year-low yields? At negative yields, in some cases?
Central banks do not buy things on the lows. They buy things on the highs.
Of course, the ECB is not trying to make money on these transactions. Which is the whole point!
The Worst Investors in US History Strike Again
Betting on the end of what is a 30-year interest rate cycle is not a productive use of our time. This bond market has claimed the careers of many investors. It reportedly hastened the retirement of Stan Druckenmiller, arguably the greatest investor of all time, who bet against bonds heavily, thinking yields could not go any lower. They did.
Let me impart some wisdom here: The first rule of finance is that there are no rules in finance. Nothing works all the time. My favorite dumb rule of finance is the one that says your percentage allocation in bonds should be equal to your age. So if you are 60, you should be 60% in bonds.
My guess is that if interest rates rise 2%-3%, people won’t be saying that anymore.
You know what I worry about? I worry about the baby boomers. I worry about this generation, the worst investors in US history, who got carried out in the tech bear market in 2000 and got caned in the financial crisis of 2008, and after having been hammered twice in the span of 10 years in the stock market, went all-in on bonds.
Why? Bonds are safe. Everyone knows stocks are not safe.
Now, in retirement, none of these people expect their bond mutual funds to get cut in half, which would happen if interest rates went up about 3%-5%.
Imagine if they did!
The disclaimer to all of this is that I’ve been a bond bear for many years, and I’ve been wrong. But for the first time, I think we have something approaching consensus that yields will stay low forever. People who think interest rates are going up are starting to sound crazy. I am starting to sound crazy. That probably means I’m close to being right.
If 10-year rates get above 3%, the previous high, we will know for sure. If that happens, pick up the Batphone, call the White House, sell everything. Why?
If you are still ignoring charts when they are making higher lows and higher highs, God help you.
Jared Dillian
 Ed Note: This article is a perspective on Martin Armstrong’s “Big Bang” in 2015.75
Renowned precious metals analyst David Morgan is out with a new book called “The Silver Manifesto.” In a chapter called “The Debt Bomb,”Morgan lays out the biggest problem and the biggest reason to own precious metals. Morgan contends, “Basically, the United States have exported our inflation to every other country. So, for them to stay competitive, they are required to weaken their own currencies for what is called competitive advantage. It simply means if they don’t print … their currencies would become too strong, and they would not be able to export. In order to keep trade flowing, these other countries are basically required to do what the U.S. government does, and that is export a great quantity of un-backed paper promises that are impossible to pay back. That’s the crux of “The Debt Bomb.” It’s going to explode. … The basic premises are: You default on the debt … or you keep kicking the can down the road, and you continue to debase the currency, which is what governments have always done when it’s a non-backed currency. If you look at the value of the Federal Reserve from 1913 to now, in a little over a hundred years, the Federal Reserve itself will admit that 100 cents is now worth about 4 cents. So, you have lost 96% of the value of the U.S. dollar…. That has been a failure, a tremendous failure. That is a collapse in slow motion. Now, what we are really arguing about is what’s going to happen to the last 4 cents of the U.S. dollar…. It looks to me that at some point, a tipping point, that you will get an acceleration … and things will change dramatically.”
On the Greek debt crisis, will it be forced to default? Morgan says, “Yes, and the problem is everyone in power is acting
like a bunch of kids. No one wants to be an adult and state the problem clearly. This new regime in Greece actually has. They are the only truth tellers at the political level that actually said we are bankrupt.”
On the price of silver, Morgan says, “What is $16 silver compared to $5 silver over a decade ago, and basically they are the same price. Isn’t that amazing, this inflation that nobody talks about. It you take the $5 silver price back in 2003, and you use the true money supply of fiat currency today, hey guess what, it is pretty close to $16. So, in a nut shell, because you are buying the same silver for basically the same amount over a decade ago, it’s really on sale. It is really a bargain.”
When might the economy and the “debt bomb” explode? Morgan predicts this fall. Why? Morgan says, “Momentum is one indicator and the money supply. Also, when I made my forecast, there is a big seasonality, and part of it is strict analytical detail and part of it is being in this market for 40 years. I got a pretty good idea of what is going on out there and the feedback I get…. I’m in Europe, I’m in Asia, I’m in South America, I’m in Mexico, I’m in Canada; and so, I get a global feel, if you will, for what people are really thinking and really dealing with. It’s like a barometer reading, and I feel there are more and more tensions all the time and less and less solutions. It’s a fundamental take on how fed up people are on a global basis. Based on that, it seems to me as I said in the January issue of the Morgan Report, September is going to be the point where people have had it.”

-
I know Mike is a very solid investor and respect his opinions very much. So if he says pay attention to this or that - I will.
~ Dale G.
-
I've started managing my own investments so view Michael's site as a one-stop shop from which to get information and perspectives.
~ Dave E.
-
Michael offers easy reading, honest, common sense information that anyone can use in a practical manner.
~ der_al.
-
A sane voice in a scrambled investment world.
~ Ed R.
Inside Edge Pro Contributors

Greg Weldon

Josef Schachter

Tyler Bollhorn

Ryan Irvine

Paul Beattie

Martin Straith

Patrick Ceresna

Mark Leibovit

James Thorne

Victor Adair