
Bonds & Interest Rates
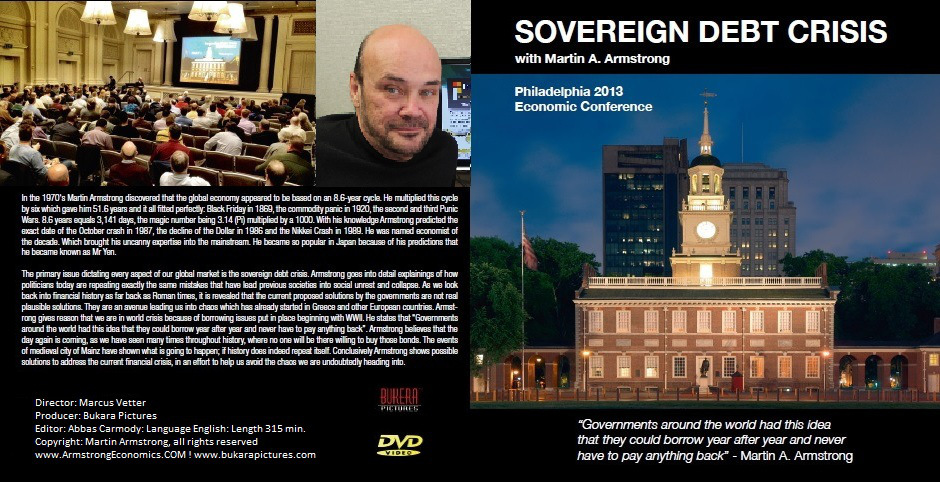
The Sovereign Debt Crisis is unfolding on schedule. I have warned at thePhiladelphia Conference that half of Germany’s municipalities are on the edge of bankruptcy as was the case with Detroit. Instead of reform, no, government just increases the tax burden upon the people who they see having an endless supply of money to be expropriated for their personal glory.
Just like a small business that keeps expanding, those in government do the same thing except it consumes money never creates anything. Socialism is not about helping the less-fortunate. It is about government workers helping themselves to what you have. This is no different from giving money to a charity and you find out 80% goes to administration costs.
In Germany where the average person already pays more than half their wages in taxes to support government, here comes another tax on top of the existing proposal to confiscate 10% of everyone’s accounts to pay for the banks. Now there will be the “solidarity” contribution (solo) which is for continuous control of government. According to information from the German economic news, the Federal Government, states and municipalities intend to share the solos revenues, in order to meet their debt service obligations. You see, there cannot be hyperinflation. Governments resort to hyperinflation ONLY when they cannot borrow or tax anymore. They will turn you upside-down and take your gold fillings before they will ever resort to printing.
What the new tax will be called, is still open to speculation. In order to bring the matter quickly across the stage, some top officials have been punished with forced furloughs to prevent their objections. It is becoming very clear: Taxpayers are dispossessed not only with low-interest rates to keep government financing artificially low, confiscation of assets to help bailout banks who lost speculating with your money, but they will have to pay 5% of their income to now bailout state and municipal debt. There will never be enough money to go around because pensions will continue, workers will retire, they will hire replacements and the size of government will grow exponentially until this bubble bursts just as a speculative bubble in stocks – there is no difference! This is a bubble in government!

There is just never any end in sight to the bull market in taxation until the bubble bursts and the people rise up creating the next revolution. That is ALWAYS the historical out come unless they can find an external enemy to create war to hide their defaults.

Plus: One of the Few Investments That Will Survive the Coming Downturn – From Chris Hunter
 Dear Diary,
The Dow rose 185 points on Friday. Gold lost $1.50 an ounce.
We spent the weekend here at our place in France painting old windows, while observing the customs and culture of young adults.
Several of our children have come to visit, bringing friends with them. We ended up with a group of a dozen or so twenty- and thirty-somethings.
One of the young men here reminds us of the French film star from the 1960s Alain Delon. Tanned. With dark, cropped hair. Dark eyes. Wearing a silk scarf.
One of the young women looks as though she could be a move star, too. Dark, curly hair. Beautiful eyes. Flirtatious. Perhaps “flighty,” too.
Our first observation is that these young people get up late. We rarely lay eyes on them before noon. Sometimes, late-night parties and jet lag combine to produce bat-like schedules. They sleep all day and come out after the sun goes down.
Last night, they all went down to the pond and made a campfire. They were still there when we went to bed.
“Oh… come sit down. How nice to see you for breakfast,” we said to one this morning. “Glad you got up early.”
“Uh… no… I was just talking with Henry. Now I’m going to bed.”
“You mean, you’ve been up all night?”
“Yeah… “
We have been exploring how the feds’ funny money policies have corrupted our society in remarkable and unexpected ways… and lulled investors asleep.
Could these strange sleeping habits be a result of artificially low rates?
Unable to get a purchase on the idea, we conclude that not everything is a feature of monetary policy.
Still, it is amazing how much of what we take for granted is a consequence of this exceptional monetary system. So, we’re devoting the upcoming month’s issue of our new project, the Bill Bonner Letter, to discussing scams, hustles and hoodwinks of the EZ money era.
After we finished writing this month’s “beta” issue, E.B. Tucker, our lead researcher, sent us yet another example:
Remember Dionne Warwick’s late night infomercials offering the answers to all life’s problems for a $3.99/min psychic consultation?
That was the Psychic Friends Network.
Now it’s entering peer-to-peer lending! It bought 321 Lend, Inc. this month.
Last year was a $5 billion year for P2P lending… and there’s huge upside.
The longer the fed keeps rates at 0%, the more “investors” will be willing to fund loans to sketchy borrowers.
And here’s the Wall Street Journal with more:
Governments and companies around the world are borrowing cash they won’t have to repay for at least three decades, seizing upon this year’s unexpected fall in interest rates to lock in cheap financing for as long as possible.
Global sales of sovereign and corporate bonds that mature after 30 years have reached $142.5 billion this year as of Tuesday, a 22% rise from the same period last year and a 55% jump from the same period in 2012, according to data provider Dealogic.
Their growth far outpaces sales of government and corporate bonds due in 30 years or less. Those bond offerings totaled $5.236 trillion so far this year, a 4.6% increase from the same period in 2012.
Why the rush to ultra-long durations?
Borrowers want to take advantage of low rates. For their part, investors want to get a little more yield.
Typically, the longer a bond’s duration, the higher the yield. Because time multiplies risk. The longer into the future you go, the more likely it is that the issuer will go broke… and rising rates will push down the price of your bond.
In the world of super-low rates and super-easy money, over the short run few debtors go belly up. In the long run all of them do. The credit cycle turns against them. Financial shocks bash them. And geopolitical disasters catch them unaware.
In a world of zero-interest rates, investors stretch for yield. It is just a matter of time until they pull a ligament.
Regards,
Bill
Further Reading: If you want to know more about how the Fed-induced bubble ends, there’s still time to claim your FREE hardcover copy of Bill’s 2009 bestseller The New Empire of Debt. Bill and co-author Addison Wiggin reveal how the financial crisis that has plagued the US will soon bring an end to this once great empire.
If you’ve ever wondered about the financial realities the country faces and what the ultimate outcome will be, Bill and Addison’s book is a must read. Read on here to claim your free copy. (All we ask is you pay the shipping costs.)
One of the Few Investments That Will Survive the Coming Downturn
One of the questions we’ve been asking ourselves at Bonner & Partners is how to take advantage of the Fed’s ultra-low interest rates.
It’s a question I put to Bill when I interviewed him for the August issue of Bonner & Partners Investor Network.
If you’re not yet familiar with Investor Network, every month I sit down with one of the investment gurus in Bill’s “inner circle.” We talk about the influences that made them the master investors they are today… and about their approach, and their philosophy, for making money in the markets. (We’ll add you as a subscriber to Investor Network when you claimyour free copy of Bill’s book The New Empire of Debt.)
Then we share it with subscribers as a print Q&A. (If you’ve read Jack Schwager’s Market Wizards books, you’ll know what I’m talking about.)
Last month, Bill talked about his new book, Hormegeddon, and why he believes the world’s financial system is headed for an even bigger meltdown than the one that struck in 2008.
I asked Bill the same question I ask all the investment gurus I interview: Is there any specific investment or strategy you like right now? Here’s what he told me:
In theory, I want to take advantage of artificially low lending rates… and use the money in a way that will bring real growth and real wealth. The idea is to take the Fed’s EZ credit and use it to build assets that won’t be wiped out when the cheap money disappears. Things like real estate, farmland, gold, etc.
You can do this in any number of ways. What you want is a company that is using cheap funding to add real output capacity. A mining company, for example, that is expanding its production. Or a timber company that is planting more trees. Or a housing company that is adding units.
But a word of warning to your readers. These are hard to find right now. Because the central bank-fueled global asset-price bubble has forced up asset prices to the point where these sensible companies are too expensive.
But one investment Bill reckons might actually benefit from the current situation is pawnbrokers. That’s because pawnbrokers are perfectly suited to surviving the prolonged downturn that Bill sees ahead.
According to Bill’s lead researcher, E.B. Tucker:
Pawnbrokers are like financial firms, but with none of the risks most lenders face. Payday lenders have to make sure the borrower doesn’t get fired. Subprime auto lenders face a different problem: Their collateral has wheels.
Pawnbrokers still cater to folks further down the economic ladder. But as Bill told me, he sees that as a “big advantage.” Because the number of potential customers is growing…
P.S. Bill and E.B. reveal the name and ticker symbol of their favorite pawnbroker play in one of the “beta” issues they’ve put together for Bill’s new paid monthly newsletter, the Bill Bonner Letter. If you would like to become a subscriber… and learn the secret that turned more than 50 of Bill’s employees into millionaires, read on here.

With the first half of 2014 now in the books, many investors are happy with the performance thus far, especially given the economic headwinds that few saw coming. The 26% rally in U.S. stocks in 2013 gave way to a more modest 7% gain in the first half of 2014. Most see this as a positive development in a maturing market. But beneath the surface, important trends are emerging that should give investors reasons to re-evaluate their assumptions.
During the second quarter of 2014 the S&P 500 continued to post new all-time highs while volatility remained remarkably low. Oftentimes such a combination reflects investor complacency which can be dangerous. Already a rotation toward more defensive positions is underway. For example, through the first half of the year, total return for the Russell 2000 (a barometer for domestic growth) was just 3.3% (IWM) while total returns for defensive assets like Treasury Bonds (TLT) and the S&P 500 Utilities sector (XLU), were 12.9% and 18.5%, respectively.

There can be little doubt that the growth momentum that buoyed the market in 2013 came off track in 2014. GDP had grown sequentially in each of the first three quarters of 2013 reaching 4.2% in 3Q13, which was the second highest level since 2006. (BEA, Jan 30, 2014). This momentum was cut short in the first quarter of 2014, which was confirmed when BEA reported annualized 1Q14 GDP at negative 2.9%.,the weakest quarter since the end of the Great Recession in 2009. While most pundits blamed the surprisingly weak performance on severe winter weather, our research suggests that the unusual cold and snow would be expected to knock just 2% of annualized growth off of GDP. Instead the results were fully six points below earlier expectations that first quarter growth would approach positive 3%.Even if the newly released preliminary estimate for 2nd quarter GDP does not get revised downward (as is usually the case with these figures), 1st half growth will come in at just 1%, or 2% annualized. This is far below the forecasts that held sway back at the end of 2013.
Despite the dismal first half miss, consensus remains that the economy will get right back up on its feet and is on the verge of hitting “escape velocity.” The forecasters base this view on optimistic view on the outlook for housing, capital investment, and employment. While we do not claim to have an edge on making near-term economic calls, we are somewhat skeptical of all three of these factors.
Housing
In 2012 and 2013, the U.S. housing market improved considerably, but this was from historically depressed levels following the Great Recession. From the 2006 peak into early 2012, the Case-Shiller Price Index declined by 35%, which provided an attractive buying opportunity for investors who were flush with cash (i.e. private equity investors), and those solvent households that were able to borrow at historically low mortgage rates (2012 average 30-yr rate 3.7% vs prior 5-yr avg. 5.3%)[2]. As a result, between 2012 and 2013, existing home sales increased 30% and house prices gained 25%.
Now, it appears those “easy gains” have ended as 1) cash investors are no longer buying and actually starting to sell, and 2) mortgage rates are set to rise as the Fed continues to Taper its QE program.[ The impact of these trends is already showing in the data. Since ex-Fed Chairman Bernanke first hinted about the QE Taper in the summer of 2013, mortgage rates have risen almost 100bps (30% increase). Over this same time, MBA Mortgage applications have fallen by 60%, existing home sales have declined 15% and house price gains have slowed. While another near-term bounce is possible, we believe a sustainable recovery is less likely. Household balance sheets remain stretched, income growth is barely keeping pace with inflation, and affordability is declining (higher house prices plus rising interest rates).
Capital Investment
In 2009, Gross Private Investment collapsed to almost 12% of GDP, which was the lowest level in the post WW2 period and compares with a median level of 19% in the three decades prior to the Great Recession. Since 2009, Gross Investment has rebounded and is now 16% of GDP. Many growth bulls expect this level to rise over the next few years, noting that the average age of U.S. capital stock (i.e. plant/equipment) is at record highs and needs to be upgraded. Recently, this view has gained traction with improvements in forward-looking surveys, like the Purchasing Managers Index (PMI). In the near-term, we do expect a modest bounce in capital investment to make up from weather related disruptions earlier in the year, but we are more skeptical about a multi-year boom.
First, we believe much of the recovery in private Investment was supported by bonus deprecation tax benefits (initiated during the recession) that enticed many corporations to accelerate investments in 2010-13. These incentives ended on Dec 31, 2013, so businesses have less reason for new investment. For companies to increase investment without government support, sales levels need to increase, which will remain difficult as household balance sheets and incomes remain under pressure. As a note, the current level of private investment (16% of GDP) is below median levels during the thirty years prior to the Great Recession (19% GDP), but it is consistent with the thirty year period following WW2 (17% GDP).
Second, companies have recently been more inclined to acquire rather than try to grow organically. In the first half of 2014, total U.S. M&A deals were over $750B, which was up 50% from the same period in 2013 and on pace to hit annual levels not seen since 2006-2007. Also, almost 95% of recent deals have been strategic (companies, not private equity, buying other companies) which compares with just 75% in 2006-07. If companies saw organic opportunities then this cash would be invested in new plant and equipment instead of paying premiums for existing firms. With easy access to relatively cheap capital, we expect the M&A spree to continue, noting that this will actually result in job losses (vs. capital spending that drives job gains).
Finally, companies that have not found attractive M&A opportunities have been using cash to raise dividends and buy back stock. In the first quarter of 2014, U.S. share buybacks and dividends hit a record level of $241 billion. Returning excess cash to shareholders is normal when growth prospects are dismal, but the recent trend has been exacerbated by activist investors that are pressuring companies to use leverage to return cash. As a result of this, combined with M&A activity discussed above, business (non-financial) leverage is at record levels. This bodes poorly for a surge in real investment.
Employment
In the first half of 2014, new job additions totaled 1.4 million (BLS establishment survey), which was the largest six-month increase since 2006. At the end of June 2014, the unemployment was 6.1%, down from 7.0% at the start of the year. Government officials have crowed that the economy has now regained all jobs lost in the Great Recession. But this is strictly a measure of quantity not quality.
It is widely understood that low paying and part time jobs have replaced higher paying full time jobs. But even the raw number of jobs has failed to keep pace with population growth. At the end of June, the employment to population ratio was 59%, essentially flat since 2010. This compares with a median level of 62% in the thirty years prior to 2006. To get back to that level, the economy would need to add another 10 million jobs. Assuming the current pace of job gains (using average of Jan-June 2014 gains in the Household survey) and trend growth in the working-age population, it would take another five years for the employment to population ratio to reach that level.
The combination of low employment to population and low labor force participation means that 41% of the working age population is not employed, which compares with pre-Great Recession levels closer to 35%. That means that roughly 100 million people or one-third of the entire U.S. population is not working. This is hardly a sign of a solid labor market.
In other words, the consensus is making a pile of questionable assumptions about the pillars upon which a continued recovery would be based.
Inflation – Showing life, but Still Dead to the Fed
But while growth is failing to materialize, inflation is on the rise. Back in January of 2012, Fed Chairman Ben Bernanke did something that no Fed Chairman had done before: He publicly set a 2% inflation target. Well, apparently, the Fed is not nearly so impotent as we had believed. It only took 2 and ½ years for the Fed to achieve this goal (this is if you give full credence to their statistics). The latest CPI report for June 2014 came in at 2.1% year over year. This follows very similar numbers in April and May. More importantly inflation shows signs of heating up more recently. The last four months of data (March – June) show average annualized month over month changes at 3.2%. Finally, the Fed has rescued us from the abyss.

Not only have they rescued us, but they hit the sweet spot. According to modern day Keynesian theories, with 2% inflation achieved and 0% interest rates, the economy should be humming right along. But the theory is not translating into practice.
Companies are starting to feel the price squeeze and are passing on rising input costs in a variety of ways. This is true across many industry verticles. Hershey just announced an 8% increase on chocolate across the board. Then Mars Candy followed suit by raising their chocolate prices 7%. Starbucks has raised prices between 5 and 20 cents per drink. Chipotle has raised prices between 4% – 12.5% depending on location. The hits keep coming: Adult tickets at Disneyland (4.3%), Netflix (12.5% for new customers), SeaWorld (3.3%), Nike (11%-20%). Even the federal government (USDA) forecasts that prices for fruits and vegetables will rise 6% in the next few months. The Food CPI index over the last four months is ominous, up 4.2% annualized. Beef prices also continue to be at all-time highs. Unfortunately these increases have risen faster than incomes.
Conclusion
Recent economic data (and asset price movements) indicate U.S. growth is slowing while inflation is rising. Should the Fed continue to reverse the former while ignoring the latter, we expect portfolios that are built with inflation sensitive assets and non-dollar exposure will outperform.
[1] Bureau of Economic Analysis (BEA), June 25, 2014
[2] Bankrate.com, Bloomberg accessed July 4, 2014
[3] National Association of Realtors (NAR) and Case-Shiller Index, Bloomberg accessed July 3, 2014
[4] New York Times, DealBook “Investors Who Bought Foreclosed Homes in Bulk Look to Sell”, June 27, 2014
[5] Business Insider, “2014 Is On Track to Become The Second Biggest Year for M&A in History”, June 30, 2014
[6] Financial Times, “US Share Buybacks and Dividends Hit Record”, June 8, 2014
[7] Bureau of Labor Statistics (BLS), Establishment Survey, July 3, 2014
[8] BLS, Household Survey, July 3, 2014
Subscribe to Euro Pacific’s Weekly Digest: Receive all commentaries by Peter Schiff, John Browne, and other Euro Pacific commentators delivered to your inbox every Monday!
To order your copy of Peter Schiff’s latest book, The Real Crash (Fully Revised and Updated): America’s Coming Bankruptcy – How to Save Yourself and Your Country, click here.
For in-depth analysis of this and other investment topics, subscribe to Peter Schiff’s Global Investor newsletter. CLICK HERE for your free subscription.

One of the great questions being debated right now is how will the market react once QE3 ends this October. Those who believe asset prices (namely stocks, bonds, and real estate) are being supported by the Fed, and not by underlying economic growth, expect a correction or worse once the Fed withdraws its support.
Richard Duncan summed up this view quite well in a recent Financial Sense Newshour interview, Prepare for a Correction Once QE3 Ends:
“[T]his is going to be a very interesting experiment because it will show us whether the economy is actually strong enough to grow by itself without government life support…and, unfortunately, I don’t think it is. For an economy to grow one or more of the following three things has to happen: either the workforce has to grow in size, wages have to go up, or credit has to expand. And, right now, none of those things are happening on a large enough scale to drive the economy… So when you remove the one thing that has been stimulating the economy and creating effective demand by pushing up asset prices and creating a wealth effect, when you remove quantitative easing, then where’s the new source of growth going to come from? I just don’t see it.”
Without sufficient credit growth in the economy, Duncan says that we’ll move back toward recession, which will then force the Fed to engage in a fourth round of quantitative easing:
“Once liquidity starts to dry up at the end of this year it looks very likely that the yield on 10-year government bonds will go up. That will cause mortgage rates to go up…the property market to come down, a significant correction in the stock market, a negative wealth effect, less consumption and, I think, then the US will start moving back towards recession. In other words, we’ll hit another economic soft patch and before that goes too far I think the Fed will once again have to jump in with another round of quantitative easing, QE4, to follow QE3 and QE2 and QE1. It will be the same pattern.”
This pattern of Fed launches QE – economy and stocks go up, Fed withdraws QE – economy and stocks go down is by now very well-known and expected by most market participants. In one sense, we might say it is the most obvious and predictable outcome. Will this pattern play out again or, as the inner contrarian in me always wonders, will the market do what we least expect?
This is where global investment strategist James Kostohryz comes in.
As we discussed in his recent interview, Stocks Likely Moving Into Bubble Phase Over Next Year or Two, what would happen if the economy and stock market fail to see, once again, the long awaited and much anticipated correction, even after QE3 ends?
If that happens—that is, we actually start to see sustainable economic growth and fears of a recession remain at bay—James believes the more likely outcome is that the stock market will enter a bubble as investor confidence really starts to take hold (note: to be fair, he actually makes a number of arguments why a bubble-like scenario in the stock market might unfold).
So, the big question is who’s right? Is the economy strong enough to finally wean itself from QE life-support or will we see the same pattern play out as before?
One of the best ways to answer this question is by comparing the strength of the U.S. economy today to when the Fed ended QE1 in 2010 and QE2 in 2011. Is the economy much stronger or more self-sustaining now than it was during those two prior periods? When we asked Ken Goldstein at the Conference Board this question, this is what he had to say:
“The answer is absolutely…the cycle is starting to move a little bit faster right now and indeed that’s what the leading indicators told us would be happening and now it’s telling us not only is it going to continue, but it might even start to pick up.”
In addition to the Conference Board, a number of other leading economic indicators have so far all come in positive for the month of July.
Here’s a table showing May, June, and available July data, which Jim Puplava covered in his most recent Big Picture broadcast.

Outside of the last two or three months, what is the direction of the larger economic trend? For that, here’s a chart of the Conference Board’s Leading Economic Index going back to the year 2000 (courtesy of Doug Short), which shows the economy has climbed steadily since 2009 and is not yet in danger of topping out and moving into a recession.

Below the Conference Board LEI is a chart of the S&P 500 over the same time period. Although some believe the market is a poor reflection of the underlying economy (and this may be true over the short-term), over the long-term there is actually a very close correlation, especially when it comes to major turning points.
Looking at the prior two cycles, you can see just how well bull market peaks coincide with a trend reversal in the Conference Board LEI. Typically, you want to start getting concerned about a major market peak once this and other LEIs breakdown.
At this point, however, the overall economic trend is still positive and does appear to be stronger than when the Fed ended QE1 and QE2. The end of QE3 could still cause market disruption, but, one thing is for certain, current and incoming economic data for the U.S. isn’t raising any red flags.

1) Ex-Div Reminder for MTY Food Group (TSE:MTY.CA) triggered: 07/30/2014
MTY Food Group is a franchisor engaged in the quick service food industry. Co.’s activities consist of franchising and operating quick service restaurants under the following banners: Tiki Ming, Sukiyaki, La Cremiere, Caferama, Au Vieux Duluth Express, Carrefour Oriental, Panini Pizza Pasta, Chick ‘N’ Chick, Franx Supreme, Croissant Plus, Villa Madina, Cultures, Thai Express, Mrs. Vanelli’s, Kim Chi, “TCBY”, Yogen Fruz, Sushi Shop, Koya Japan, Vie & Nam, Tandori, O’Burger, Tutti Frutti, Taco Time, Country Style, Bunsmaster and Valentine. As of Nov 30 2010, Co. had 1,727 stores in operation, of which 1,701 stores were franchised and 26 stores were operated by Co. – Slide 2 HERE

Read full article in a new window: Ex-Div Reminder for MTY Food Group (TSE:MTY.CA)
![]()

-
I know Mike is a very solid investor and respect his opinions very much. So if he says pay attention to this or that - I will.
~ Dale G.
-
I've started managing my own investments so view Michael's site as a one-stop shop from which to get information and perspectives.
~ Dave E.
-
Michael offers easy reading, honest, common sense information that anyone can use in a practical manner.
~ der_al.
-
A sane voice in a scrambled investment world.
~ Ed R.
Inside Edge Pro Contributors

Greg Weldon

Josef Schachter

Tyler Bollhorn

Ryan Irvine

Paul Beattie

Martin Straith

Patrick Ceresna

Mark Leibovit

James Thorne

Victor Adair