
Currency
USDCAD Overnight Range 1.2950-1.3045
A strong and much needed rebound in Canadian Retail Sales data for May (Actual 1.0% vs. forecast 0.5%) provided the Loonie with an ever-so-modest and extremely short lived gain this morning. USDCAD dipped about 0.0010 points to 1.2957 and then reversed course and is now above 1.3000 again. That’s because the data is considered “stale”. Meanwhile today’s weekly US Jobless claims report was released at the same time and it is fresher and therefore relevant. Jobless claims declined to 255,000 and refocused traders on the prospect for a September rate hike. The US dollar gained across the board.
Overnight saw a continuation of the previous day’s US dollar sell-off. Kiwi dominated the Asian session. The RBNZ delivered the expected 25 bp rate cut and in a classic “sell-the-rumour, buy-the –fact” move NZDUSD rallied to 0.6690 from 0.6570.
European FX trading was choppy albeit with lower than usual volumes. The EURUSD jump to 1.1000 from 1.0925 left traders scratching their heads for a reason.The jobless claims data drove EURUSD back to 1.0960. In Britain, a poor UK retail Sales report triggered a dive in GBPUSD and it hasn’t recovered.
The prospect of lower oil prices and higher US rates will limit any near term USDCAD losses. WTI is in a downtrend while trading below $50.52/bbl with yesterday’s breach of support at $49.70 expected to cap intraday gains. September is still the favoured month for a US rate increase, reinforced by today’s jobless claims data.
Technical Outlook
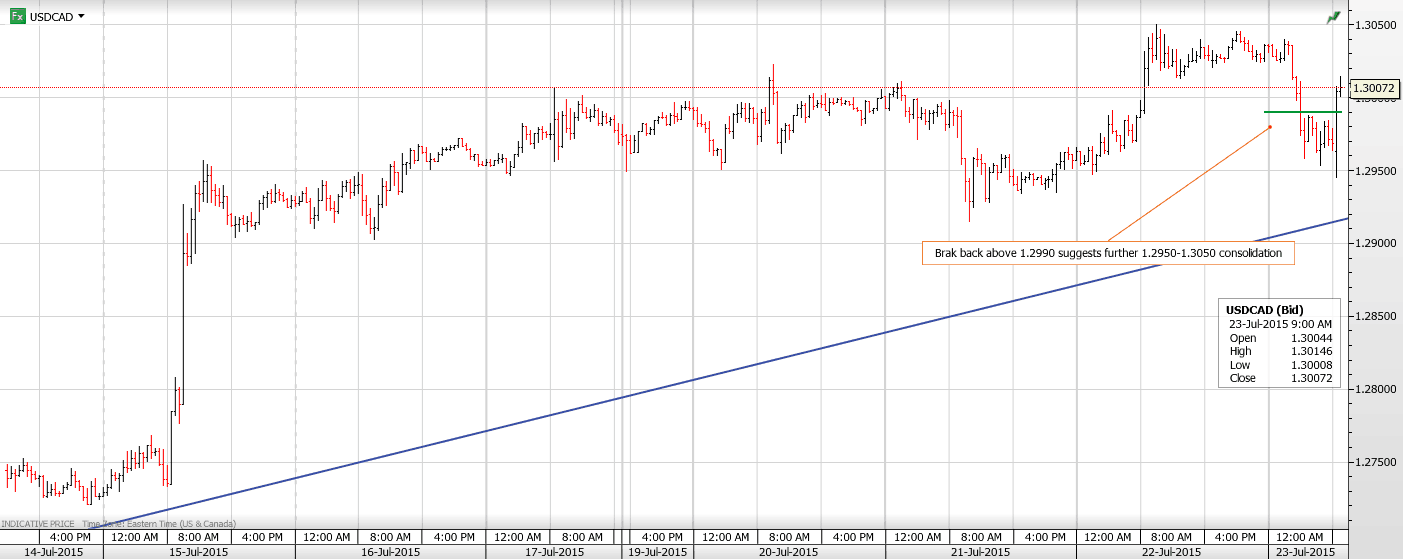
The USDCAD intraday technicals have flipped back to bullish following this morning’s failure to extend losses below 1.2950 and its subsequent rally above intraday resistance at 1.2990 argues for additional 1.2950-1.3050 consolidation. The uptrend from the beginning of the month remains intact while trading above the 1.2900-30 area.
Today’s Range 1.2960-1.3020
Chart: USDCAD 30 minute showing break of intraday resistance Larger Chart

USDCAD Overnight Range 1.2976-1.3010
USDCAD see-sawed around 1.3000 overnight and this morning. The pside momentum has stalled, for the moment, although retreats are shallow and unconvincing. The underlying USDCAD sentiment is bullish on the back of a) slowing economy, b) soft oil prices and softer commodity prices, c) widening CAD/US interest rate differentials. That won’t change in the short term.
The current USDCAD price action suggests that FX option barriers at various levels above 1.3020 are being defended.
FX markets languished within narrow trading bands in an unremarkable overnight session, totally devoid of the gut-churning volatility seen often, last week. The highlight of the Australian session was supposed to be the RBA minutes. They weren’t. Japanese traders returned from a long weekend to the Bank of Japan minutes and the Monthly Economic Report. Same thing as in Australia; no interest.
The European session wasn’t any better. EURUSD and GBPUSD bounced around without really going anywhere. The lack of key US data today (and the rest of the week) suggests a similar session for North America traders is likely.
Technical Outlook
The USDCAD intraday technicals are unchanged from yesterday. They are bullish within a narrow, rising 1.2970-1.3050 channel. A move below 1.2970 targets 1.2910 while a break above 1.3050 opens the road to 1.3300. For today, USD support is at 1.2970 and 1.2940. Resistance is at 1.3010 and 1.3030
Today’s Range 1.2960-1.3010
Chart: USDCAD hourly with rising channel Larger Chart


Quotable
The boast of heraldry, the pomp of pow’r,
And all that beauty, all that wealth e’er gave,
Awaits alike th’inevitable hour.
The paths of glory lead but to the grave.
Thomas Gray
Commentary & Analysis
Schadenfreude: That buy gold and sell the dollar thing doesn’t seem to be working out
I realize it’s not fair to pile on, but there is a certain joy one experiences when the blather from the cocky prognosticators of dollar doom and gold love are proven so utterly wrong by Mister Market. The German word schadenfreude says it best.
Scientific analysis this is not, but it is interesting, I think…the symmetry meme suggests we may have a couple more years left in this commodity bear market relative to stocks; which likely means we have another couple of years left in this US dollar bull market…but, confident we never should be as every moment in the market is unique (to paraphrase Mark Douglas).
I presented the Stocks/Commodities Ratio chart below, back in May of 2014, during an online webinar titled, US $ Reserve Currency Status: Is the US dollar doomed or is a powerful dollar bull market ready to resume. The chart shows the relationship between financial assets, i.e. stocks, measured by the S&P 500 Index, and real assets, i.e. commodities, measured by the Thomson Reuters Commodities Index. In short, the S&P 500 divided by the Commodities Index. So, when the value goes down, it means commodities are gaining relative to stocks, and vice versa. I said at the time, May of last year, it looked like the 10-year bull market in commodities was clearly over; the S/C ratio was at 6.14. The ratio has since jumped to 9.92; or about 60% (and sitting bang on the 61.8% retracement level—correction time?). Stocks are smoking commodities.
So what drove down the S/C ratio, favoring commodities over stocks, from 1999 to mid-2008? Clearly the insatiable demand for commodities from China and symbiotic relationship it created between the US and China, i.e. China sends stuff, the US sends back dollars, China reinvests those dollars in US Treasuries, dollar liquidity explodes globally (evidenced by the massive US current account deficit).
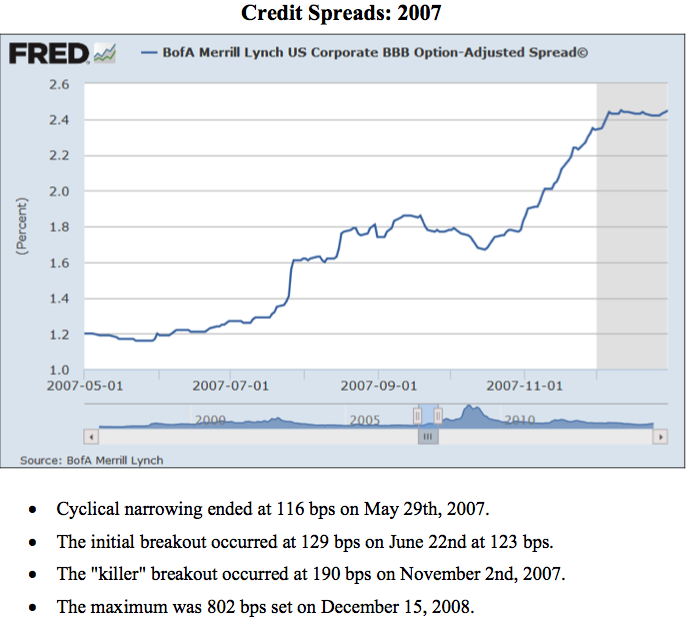
So what ended the game and drove the S/C ratio higher, favoring stocks over commodities–the Credit Crunch. It was a sea change event in the global economy. It marked the beginning of the new bull market in the US dollar, and we said as much at the time.
And why do I care about the S/C ratio? Because it appears highly correlated with the direction of the US dollar and could give us clues as to when the current dollar bull market has run its course.
Thanks to the elusive gift of hindsight we now all know China was the driver of the commodities bull market. Of course back in 1998-99 not too many realized just how strong the impact of China would have on global markets. And suspect not too many people realized how the symbiotic relationship between China and the US would impact negatively on the US dollar at the time.
So how when and how will this cycle end? If we get symmetry in duration going forward, maybe this cycle runs another 2-3 years. We can conjecture on the future trigger event(s) from now till the cows come home and develop plausible rational scenarios, but we don’t know what it will be. It is likely something already at work beneath the surface, that seen and unseen stuff that Frederic Bastiat warned us about.
But to get a sense of what types of things we should be watching for, let’s look at the key global macro triggers for major trend changes in the US dollar index since the dollar left the gold standard and began trading based on supply and demand factors against the other major currencies.
You will see this chart in the webinar PowerPoint I referred to above; it displays the global macro events, identified with hindsight, which led to a major trend change in the US dollar:
Since the Gold Standard was abandoned in 1971, we have seen three major bear markets in the dollar, all lasting about seven years, and two major bull market moves (the first seven years in duration, the second about 10 years). We are now in the midst of the third major bull market in the dollar, my guess is it carries out to 2018—representing about 10 years.
Macro Events Leading to Change in US Dollar Trend:
- Abandoned Gold Standard – Bear Market
- Fed Chairman Volcker hike rates to squeeze out inflaiton – Bull Market
- Plaza Accord because the dollar was too high (yen too low really) – Bear Market
- Tech Company Boom – Bull Market
- Tech Company Bust/Global Deflation Fear – Bear Market
- Credit Crunch (end of US/China symbiotic relationship) – Bull Market
- _____Unknown Event___________________________ — Bear Market
I realize there are plenty of gurus out there who already know exactly why the US dollar will fall again, and they likely know exactly when it will happen. Here is my tip of the day—they don’t know!
Readers of Currency Currents have seen the boom-bust sequence chart below before. I do believe it does represent how humans drive price action in free- and quasi-free markets; granted it is a very stylized view but still helpful.
- Commodities – Given the news of a 13-year low in the commodities index today, we are into the “fear” stage, but not yet into “despair.”
- The US dollar – We are either late in the “growing convictions” stage or in the beginning of “hubris” stage and setup for overshoot territory.
If the US dollar were to test the highs of that last bull market, we have approximately another 20% to go—that’s a lot.
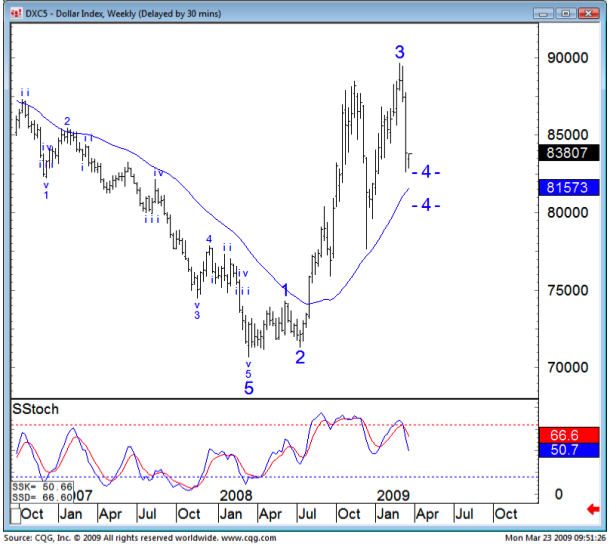
US $ Index vs. Gold Weekly: Can you say mirror image?

The best way to participate in the US dollar bull market, and its corrections along the way, may be through currency options. And you may want to consider subscribing to our Currency Options Strategist; it is only $395 per year. [Our Canadian dollar put idea is working nicely, as talked about in our last Currency Currents. We are up about 100% based on Friday’s bid price on the option—see below.]
It is simple to use. We tell you when to buy a put or call on a major currency, using exchange listed ETFs. We tell you when to get out and take profit or cut loses. We never use any strategies but “buy a put” or “buy a call” so you always have limited risk and know what that risk is when you make the trade. We use options as simple long-term directional bets on the direction of a major currency against the US dollar.
Current Open Positions: Black Swan Currency Options Strategist.

We are short euro, Aussie, and Canadian dollar in our options service; fortunately all are profitable at the moment. We may look to grab some open gains soon, maybe peel off half profits on some of the positions and let the rest ride for more, i.e. keep some skin in the game.
If you are tired of failed prognostications and one-way hyperbolic bets from the guru crowd and are looking for a service that plays both sides of the US dollar move in an effort to make money for its subscribers and does not pretend it can forecast markets, you may want to give Black Swan Currency Options a try.
Regards,
Jack Crooks
President, Black Swan Capital
Twitter: @bswancap
USDCAD Overnight Range 1.2952-1.3005
USDCAD dipped initially on the release of the CPI data (Actual 2.3%, Core 1.0% y/y) which was in-line with forecasts and a tad on the “ok” side. The move was exceedingly brief and within seconds the Loonie was ringing the 1.3000 bell, aided in part by better than expected US housing data. It has since retreated but the dip was shallow.
Overnight trading was subdued. The Loonie drifted quietly in Asia where a number of centers were closed for holidays to celebrate end of Ramadan. The markets weren’t much livelier in Europe, either. It appears that with the curtain coming down on the final act in the Greek/EU drama (or at least for intermission), the signing of a US and friends nuclear deal with Iran and Janet Yellen’s testimony out of the way, traders had nothing to worry about and nothing to do.
In the UK, Mark Carney tried to fill the void. He opened up a can of worms last Tuesday when he started talking about rate hikes. Those remarks were overshadowed by Greece, Iran, Yellen and China so he took another swing of the bat yesterday and hinted a rate hike around the “turn of the year”. This morning, he is tripping over his tongue trying to unsay what he said about the direction and timing of UK interest rate moves.
USDCAD is still bid and it wouldn’t be out of character for this currency pair to make a late day push and close above 1.3000
Technical Outlook
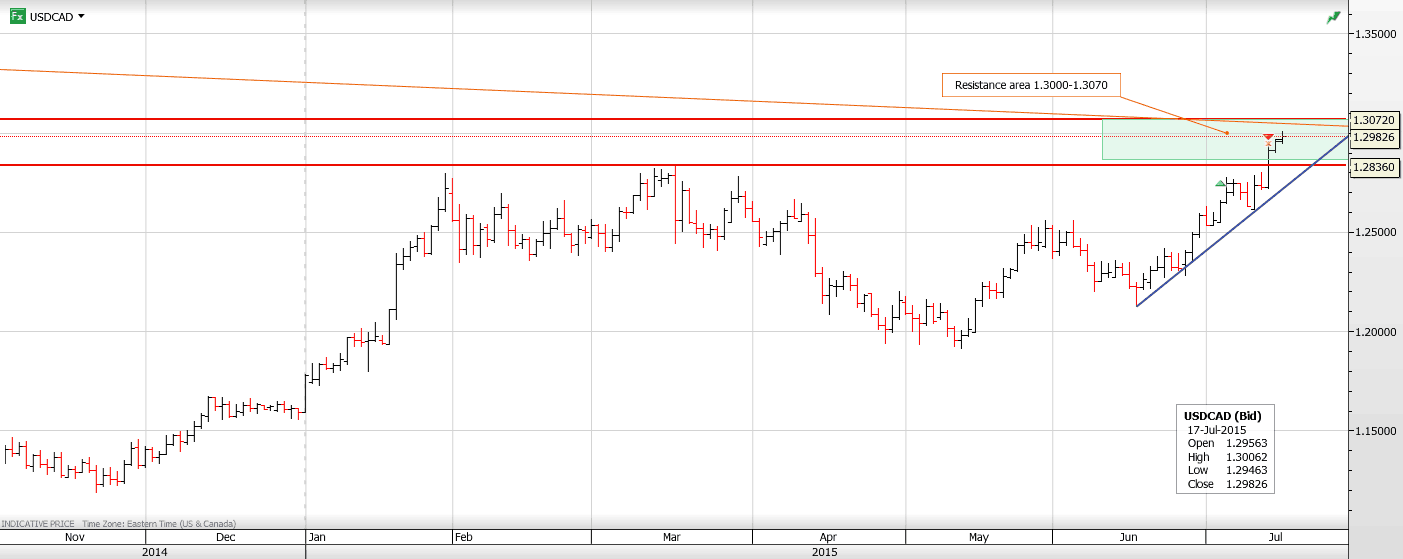
The intraday USDCAD technicals are bullish while trading above 1.2910 with minor support seen at 1.2950 and looking to extend gains to 1.3050. There is a lot of resistance between 1.3000 and 1.3050 dating back to 2008-2009. A move below 1.2950 will meet strong support in the 1.2880-1.2910 area. For today, USDCAD support is at 1.2950, 1.2920 and 1.2890. Resistance is at 1.3005 (intraday high) and 1.3050.
Today’s Range 1.2960-1.3030
Chart: USDCAD daily showing resistance zone above 1.3000 Larger Chart
Forex Trading Alert originally sent to subscribers on July 16, 2015, 7:28 AM.
The situation in EUR/USD has deteriorated after Greece’s parliament passed harsh austerity measures demanded by the country’s creditors in order to secure a third bailout package. As a result, the pair dropped to levels not seen since May. Time for double bottom or further declines?
In our opinion the following forex trading positions are justified – summary:
- EUR/USD: short (stop-loss order at 1.1058)
- GBP/USD: none
- USD/JPY: none
- USD/CAD: none
- USD/CHF: none
- AUD/USD: none
EUR/USD

The first thing that catches the on the above chart is a breakdown below the lower border of the blue consolidation, which is a bearish signal that suggests further deterioration.
What impact did this drop have on the very short-term picture? Let’s check.
From this perspective, we see that EUR/USD broke below the orange zone based on the previous lows. In this way, the exchange rate invalidated a potential reverse head and shoulders formation, which Is a bearish signal that suggests further deterioration (especially when we factor in the current position of the indicators). How low could the exchange rate go in the coming days? In our opinion, the initial downside target for currency bears would be around 1.0818-1.0845, where the May low and the 61.8% Fibonacci retracement are. If this area is broken, e may see a decline to the medium-term green support line (currently around 1.0703) or even to 1.0676-1.0698, where the green support zone (created by the 76.4% and 78.6% Fibonacci retracement levels) is.
Very short-term outlook: bearish
Short-term outlook: mixed with bearish bias
MT outlook: mixed
LT outlook: mixed
Trading position (short-term; our opinion): Short positions (with a stop-loss order at 1.1058) are justified from the risk/reward perspective at the moment. We will keep you informed should anything change, or should we see a confirmation/invalidation of the above.
USD/CHF


Looking at the daily chart we see that the most important improvement of recent days is a successful breakout above the long-term red line and the orange resistance zone. With the last upswing USD/CHF broke also above the May high, which means that the way to the 50% Fibonacci retracement is open. If it is broken, the next target would be around 0.9627 (the 100% Fibonacci price projection marked with blue on the weekly chart) or even the upper border of the rising trend channel (currently around 0.9648).
Very short-term outlook: bullish
Short-term outlook: mixed with bullish bias
MT outlook: mixed
LT outlook: mixed
Trading position (short-term; our opinion): No positions are justified from the risk/reward perspective at the moment. We will keep you informed should anything change, or should we see a confirmation/invalidation of the above.
AUD/USD
In our last commentary on this currency pair, we wrote the following:
(…) the pair remains under the red declining resistance line (the lower border of the declining trend channel), which suggests that as long as there is no invalidation of the breakdown another pullback is likely. If this is the case, and the pair moves lower from here, it would be a bearish signal, which will likely result in a test of the recent low or even trigger a decline to the 127.2% extension in the coming day(s).
As you see on the daily chart, the situation developed in line with the above scenario and AUD/USD reached our downside target yesterday. Although this support level triggered a small rebound earlier today, we maintain our assumption that as long as there is no invalidation of the breakdown below the red declining resistance line another pullback is likely. How low could the pair go? If today’s low is broken, the next target would be around 0.7320 where the brown support line is. However if currency bears manage to push the exchange rate lower, we may see a decline even to (around 0.7097-0.7200, where the green support zone based on the 76.4% and 78.6% Fibonacci retracement levels (marked on the weekly chart) is.
Very short-term outlook: mixed with bearish bias
Short-term outlook: mixed
MT outlook: mixed
LT outlook: mixed
Trading position (short-term; our opinion): No positions are justified from the risk/reward perspective at the moment. We will keep you informed should anything change, or should we see a confirmation/invalidation of the above.
Thank you.
Nadia Simmons
Forex & Oil Trading Strategist
Przemyslaw Radomski, CFA
Founder, Editor-in-chief

-
I know Mike is a very solid investor and respect his opinions very much. So if he says pay attention to this or that - I will.
~ Dale G.
-
I've started managing my own investments so view Michael's site as a one-stop shop from which to get information and perspectives.
~ Dave E.
-
Michael offers easy reading, honest, common sense information that anyone can use in a practical manner.
~ der_al.
-
A sane voice in a scrambled investment world.
~ Ed R.
Inside Edge Pro Contributors

Greg Weldon

Josef Schachter

Tyler Bollhorn

Ryan Irvine

Paul Beattie

Martin Straith

Patrick Ceresna

Mark Leibovit

James Thorne

Victor Adair